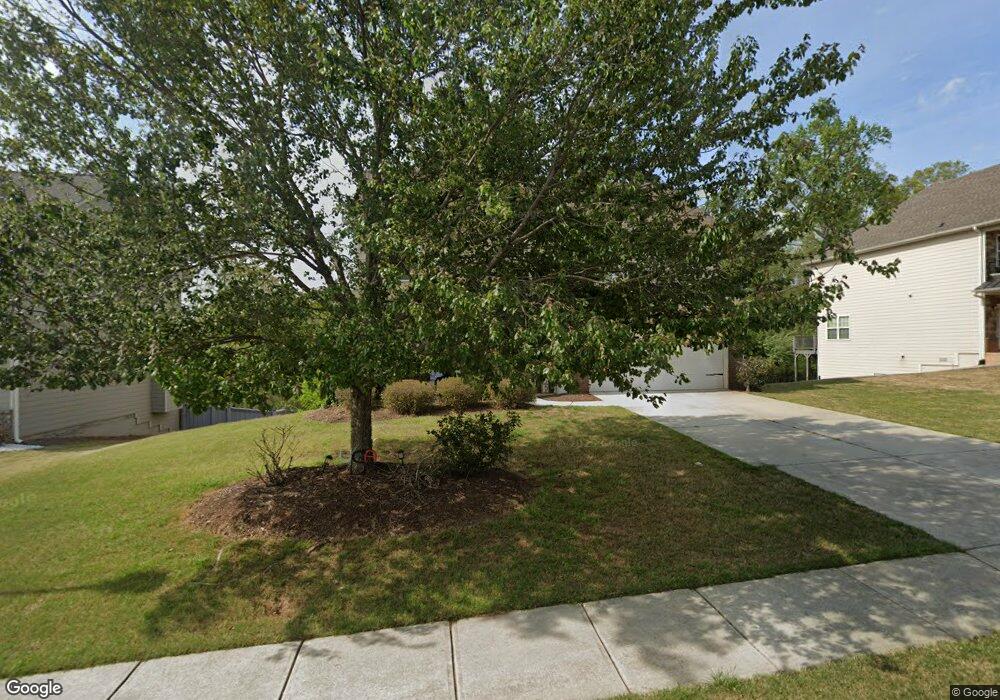
6275 Cove Creek Dr Flowery Branch, GA 30542
Estimated Value: $459,000 - $536,000
4
Beds
4
Baths
2,412
Sq Ft
$202/Sq Ft
Est. Value
About This Home
This home is located at 6275 Cove Creek Dr, Flowery Branch, GA 30542 and is currently estimated at $486,176, approximately $201 per square foot. 6275 Cove Creek Dr is a home located in Hall County with nearby schools including Flowery Branch Elementary School, West Hall Middle School, and West Hall High School.
Ownership History
Date
Name
Owned For
Owner Type
Purchase Details
Closed on
Dec 15, 2017
Sold by
Sfr Atl I Llc
Bought by
Cerberus Sfr Holdings Lp
Current Estimated Value
Purchase Details
Closed on
Mar 13, 2014
Sold by
Rnt I Llc
Bought by
Sfr Atl I Llc
Purchase Details
Closed on
Jun 29, 2012
Sold by
Drd Development & Land Inc
Bought by
Rnt I Llc
Purchase Details
Closed on
Dec 6, 2011
Sold by
Drd Development & Land Inc
Bought by
The Brand Banking Co
Purchase Details
Closed on
Mar 30, 2010
Sold by
Chapel Station Llc
Bought by
Drd Dev & Land Inc
Home Financials for this Owner
Home Financials are based on the most recent Mortgage that was taken out on this home.
Original Mortgage
$402,900
Interest Rate
3.5%
Purchase Details
Closed on
Oct 17, 2007
Sold by
Ewell Llc
Bought by
Chapel Station Llc
Create a Home Valuation Report for This Property
The Home Valuation Report is an in-depth analysis detailing your home's value as well as a comparison with similar homes in the area
Home Values in the Area
Average Home Value in this Area
Purchase History
| Date | Buyer | Sale Price | Title Company |
|---|---|---|---|
| Cerberus Sfr Holdings Lp | -- | -- | |
| Sfr Atl I Llc | $156,215 | -- | |
| Rnt I Llc | $259,962 | -- | |
| The Brand Banking Co | -- | -- | |
| Drd Dev & Land Inc | $110,000 | -- | |
| Drd Development & Land Inc | $55,000 | -- | |
| Chapel Station Llc | $1,125,000 | -- |
Source: Public Records
Mortgage History
| Date | Status | Borrower | Loan Amount |
|---|---|---|---|
| Previous Owner | Drd Development & Land Inc | $402,900 |
Source: Public Records
Tax History Compared to Growth
Tax History
| Year | Tax Paid | Tax Assessment Tax Assessment Total Assessment is a certain percentage of the fair market value that is determined by local assessors to be the total taxable value of land and additions on the property. | Land | Improvement |
|---|---|---|---|---|
| 2024 | $4,556 | $174,360 | $26,640 | $147,720 |
| 2023 | $4,499 | $172,360 | $26,320 | $146,040 |
| 2022 | $4,270 | $156,520 | $31,560 | $124,960 |
| 2021 | $3,217 | $113,440 | $14,360 | $99,080 |
| 2020 | $2,962 | $120,360 | $14,360 | $106,000 |
| 2019 | $3,248 | $112,080 | $14,360 | $97,720 |
| 2018 | $2,912 | $100,200 | $14,040 | $86,160 |
| 2017 | $2,387 | $99,320 | $14,040 | $85,280 |
| 2016 | $2,335 | $78,680 | $9,440 | $69,240 |
| 2015 | $2,066 | $76,320 | $7,080 | $69,240 |
| 2014 | $2,066 | $69,542 | $8,680 | $60,862 |
Source: Public Records
Map
Nearby Homes
- 6619 Blue Cove Dr
- 6084 Lights Ferry Rd
- 5751 Turnstone Trail
- 6409 Eva Rd
- 6075 Lights Ferry Rd
- 5761 Screech Owl Dr
- 6224 Germantown Dr
- 5922 Terrace Lake Point
- 6352 Lights Ferry Rd
- 5512 Coalie Trace
- 5729 Jim Crow Rd
- 6030 Terrace Lake Point
- 5918 Nachoochee Trail
- 5954 Overby Rd
- 5437 Hargrove Way
- 5441 Hardgrove Way
- 5993 Overby Rd
- 5573 Ashmoore Ct
- 6271 Cove Creek Dr
- 6279 Cove Creek Dr
- 6267 Cove Creek Dr
- 6283 Cove Creek Dr Unit 32
- 6283 Cove Creek Dr
- 6632 Blue Cove Dr
- 6263 Cove Creek Dr
- 6628 Blue Cove Dr Unit 76
- 6628 Blue Cove Dr
- 6636 Blue Cove Dr
- 6276 Cove Creek Dr
- 6272 Cove Creek Dr Unit 23
- 6272 Cove Creek Dr
- 6640 Blue Cove Dr
- 6280 Cove Creek Dr
- 6624 Blue Cove Dr
- 6268 Cove Creek Dr
- 6620 Blue Cove Dr
- 6259 Cove Creek Dr
- 6287 Cove Creek Dr