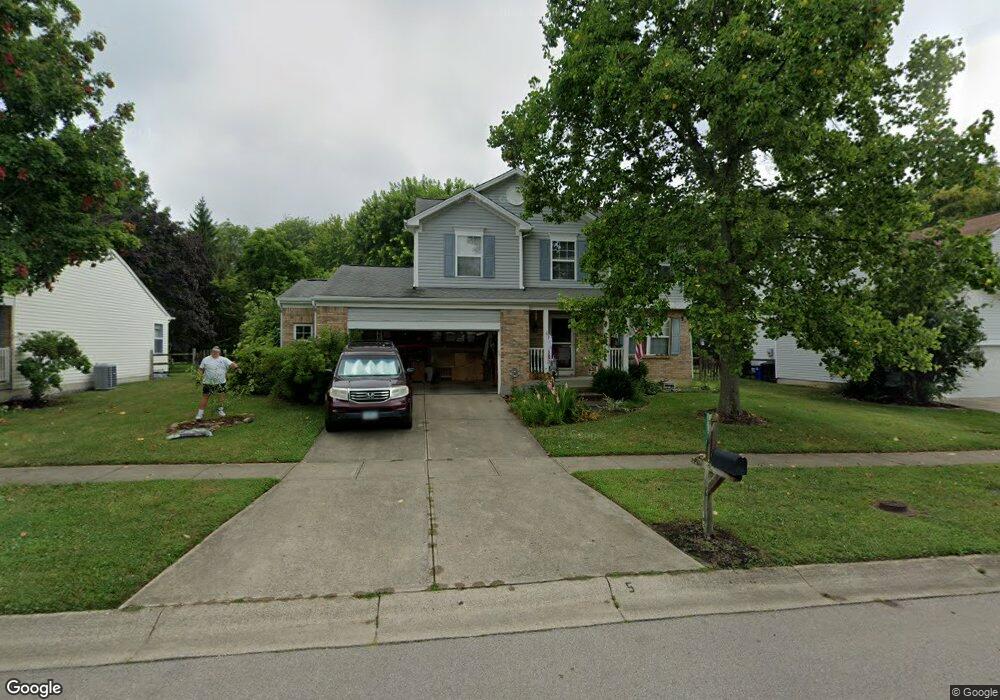
6275 Maple Grove Morrow, OH 45152
Estimated Value: $366,000 - $403,000
4
Beds
3
Baths
2,050
Sq Ft
$188/Sq Ft
Est. Value
About This Home
This home is located at 6275 Maple Grove, Morrow, OH 45152 and is currently estimated at $386,259, approximately $188 per square foot. 6275 Maple Grove is a home located in Warren County with nearby schools including Little Miami Early Childhood Center, Little Miami Intermediate Middle School, and Little Miami Middle School.
Ownership History
Date
Name
Owned For
Owner Type
Purchase Details
Closed on
Oct 7, 1998
Sold by
Ryland Group Inc
Bought by
Blow Stephen F and Blow Jennifer C
Current Estimated Value
Home Financials for this Owner
Home Financials are based on the most recent Mortgage that was taken out on this home.
Original Mortgage
$126,050
Outstanding Balance
$24,351
Interest Rate
6.97%
Mortgage Type
New Conventional
Estimated Equity
$361,908
Create a Home Valuation Report for This Property
The Home Valuation Report is an in-depth analysis detailing your home's value as well as a comparison with similar homes in the area
Home Values in the Area
Average Home Value in this Area
Purchase History
| Date | Buyer | Sale Price | Title Company |
|---|---|---|---|
| Blow Stephen F | $158,350 | -- |
Source: Public Records
Mortgage History
| Date | Status | Borrower | Loan Amount |
|---|---|---|---|
| Open | Blow Stephen F | $126,050 |
Source: Public Records
Tax History
| Year | Tax Paid | Tax Assessment Tax Assessment Total Assessment is a certain percentage of the fair market value that is determined by local assessors to be the total taxable value of land and additions on the property. | Land | Improvement |
|---|---|---|---|---|
| 2025 | $4,930 | $111,210 | $28,000 | $83,210 |
| 2024 | $4,930 | $111,210 | $28,000 | $83,210 |
| 2023 | $4,303 | $86,611 | $12,915 | $73,696 |
| 2022 | $4,254 | $86,611 | $12,915 | $73,696 |
| 2021 | $4,054 | $86,611 | $12,915 | $73,696 |
| 2020 | $3,861 | $70,417 | $10,500 | $59,917 |
| 2019 | $3,926 | $70,417 | $10,500 | $59,917 |
| 2018 | $3,836 | $70,417 | $10,500 | $59,917 |
| 2017 | $3,160 | $58,170 | $9,177 | $48,993 |
| 2016 | $3,237 | $58,170 | $9,177 | $48,993 |
| 2015 | $3,235 | $58,170 | $9,177 | $48,993 |
| 2014 | $3,651 | $58,170 | $9,180 | $48,990 |
| 2013 | $3,591 | $66,560 | $10,500 | $56,060 |
Source: Public Records
Map
Nearby Homes
- 668 Thornton Dr
- 704 Oak Forest Dr
- 723 Grande Oaks Dr
- 616 Crabapple Ct
- 873 E US Highway 22 and 3
- 873 U S 22
- 5805 Turning Leaf Way
- 6046 Driftwood Ct
- 6250 Avebury Ct
- 1065 Dunstan Ct
- 161 Arbor Glen Ct
- 5705 Pepperridge Ct
- 477 Auburn Grove Dr
- 5548 Castle Dr
- 553 Auburn Grove Dr
- 1327 Chelsea Ct
- 122 Deere Run Ln
- 120 Ridgeview Ln
- 5172 Williams Ridge Dr
- 920 Pondside Ln
- 6263 Maple Grove
- 6289 Maple Grove
- 6251 Maple Grove
- 6301 Maple Grove
- 6278 Maple Grove
- 6266 Maple Grove
- 6290 Maple Grove
- 6237 Maple Grove
- 6313 Maple Grove
- 6250 Maple Grove
- 6304 Maple Grove
- 6325 Maple Grove
- 6230 Maple Grove
- 6316 Maple Grove
- 6244 Winding Way
- 6337 Maple Grove
- 6216 Maple Grove
- 6258 Winding Way
- 6205 Maple Grove
- 6214 Winding Way
Your Personal Tour Guide
Ask me questions while you tour the home.