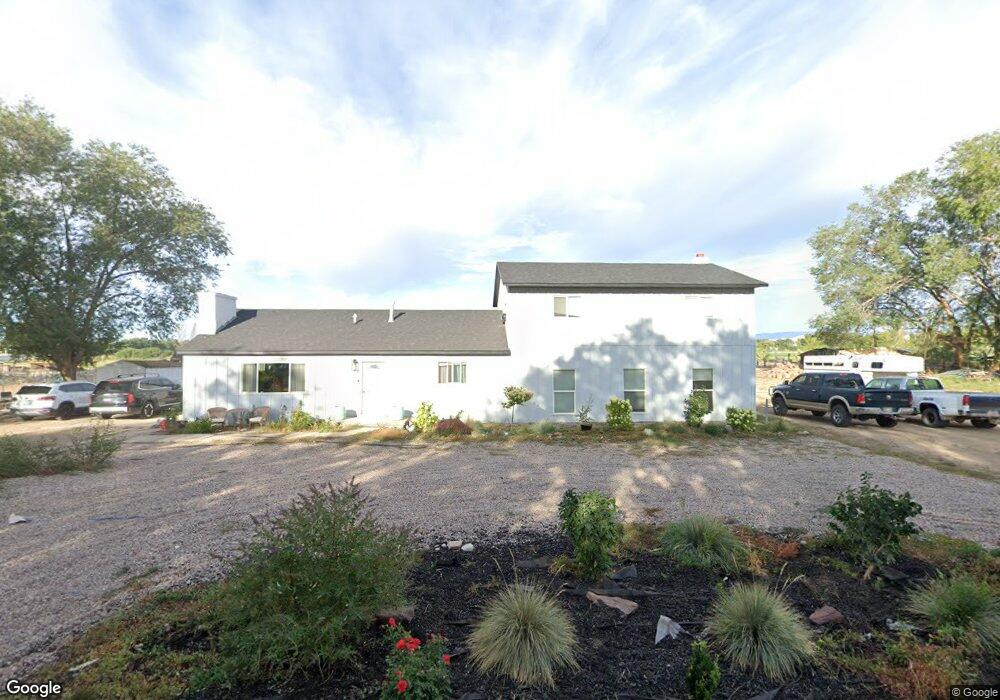
6276 S 9000 E Jensen, UT 84035
Estimated Value: $429,213 - $590,000
5
Beds
3
Baths
3,284
Sq Ft
$150/Sq Ft
Est. Value
About This Home
This home is located at 6276 S 9000 E, Jensen, UT 84035 and is currently estimated at $492,053, approximately $149 per square foot. 6276 S 9000 E is a home located in Uintah County with nearby schools including Davis School, Vernal Middle School, and Uintah Middle School.
Ownership History
Date
Name
Owned For
Owner Type
Purchase Details
Closed on
Nov 23, 2021
Sold by
Batty Gary M
Bought by
Batty Gary M and Batty Joeley
Current Estimated Value
Home Financials for this Owner
Home Financials are based on the most recent Mortgage that was taken out on this home.
Original Mortgage
$320,512
Outstanding Balance
$294,301
Interest Rate
3.14%
Mortgage Type
New Conventional
Estimated Equity
$197,752
Purchase Details
Closed on
Jan 12, 2021
Sold by
Vernal Property Managers Llc
Bought by
Batty Gary Matthew
Purchase Details
Closed on
Jan 22, 2016
Sold by
Stubbs Chet R
Bought by
Stubbs Dottie K
Purchase Details
Closed on
Mar 29, 2005
Sold by
Slaugh Lee Jay and Slaugh Roxanne
Bought by
Stubbs Dottie K and Stubbs Chet R
Home Financials for this Owner
Home Financials are based on the most recent Mortgage that was taken out on this home.
Original Mortgage
$119,250
Interest Rate
7.85%
Mortgage Type
Adjustable Rate Mortgage/ARM
Create a Home Valuation Report for This Property
The Home Valuation Report is an in-depth analysis detailing your home's value as well as a comparison with similar homes in the area
Purchase History
| Date | Buyer | Sale Price | Title Company |
|---|---|---|---|
| Batty Gary M | -- | None Available | |
| Batty Gary Matthew | -- | New Title Company Name | |
| Batty Gary Matthew | -- | New Title Company Name | |
| Batty Gary Matthew | -- | New Title Company Name | |
| Batty Gary Matthew | -- | Advanced Title | |
| Batty Gary Matthew | -- | Advanced Title | |
| Batty Gary Matthew | -- | Advanced Title | |
| Stubbs Dottie K | -- | Sunrise Title | |
| Stubbs Dottie K | -- | -- |
Source: Public Records
Mortgage History
| Date | Status | Borrower | Loan Amount |
|---|---|---|---|
| Open | Batty Gary Matthew | $320,512 | |
| Closed | Batty Gary Matthew | $320,512 | |
| Previous Owner | Stubbs Dottie K | $119,250 |
Source: Public Records
Tax History
| Year | Tax Paid | Tax Assessment Tax Assessment Total Assessment is a certain percentage of the fair market value that is determined by local assessors to be the total taxable value of land and additions on the property. | Land | Improvement |
|---|---|---|---|---|
| 2024 | $1,840 | $204,138 | $43,117 | $161,021 |
| 2023 | $1,818 | $204,138 | $43,117 | $161,021 |
| 2022 | $1,872 | $172,038 | $43,117 | $128,921 |
| 2021 | $1,269 | $53,037 | $23,714 | $29,323 |
| 2020 | $1,393 | $108,321 | $43,750 | $64,571 |
| 2019 | $1,403 | $108,321 | $43,750 | $64,571 |
| 2018 | $1,364 | $105,246 | $43,750 | $61,496 |
| 2017 | $13 | $105,246 | $43,750 | $61,496 |
| 2016 | $1,330 | $114,192 | $43,750 | $70,442 |
| 2015 | $1,227 | $114,192 | $43,750 | $70,442 |
| 2014 | $1,145 | $108,044 | $43,190 | $64,854 |
| 2013 | $1,170 | $108,044 | $43,190 | $64,854 |
Source: Public Records
Map
Nearby Homes
- 7600 E 6000 S
- 9235 S Redwash Hwy
- 6088 S 5500 E
- 5859 E Ashley Creek St
- 2098 Goose Ranch Rd
- 1972 Goose Ranch Rd
- 2042 Goose Ranch Rd
- 1804 Goose Ranch Rd
- 2148 Goose Ranch Rd
- 1902 Goose Ranch Rd
- 4111 E 4000 S
- 3955 4000 East St
- 3203 S 4000 E
- 3340 E 5000 S
- 3541 U S Highway 40
- 5065 S 3150 E
- 3331 E 3500 S Unit 4
- 3311 E 3500 S Unit 3
- 4977 S 2625 E
- 4726 S 2500 E
- 6232 S 9000 St E
- 6237 S 9000 E
- 6330 S 9000 E
- 6349 S 9000 St E
- 6438 S 9000 E
- 6454 S 9000 E
- 9122 E 6000 S
- 8985 E 6500 St S
- 8951 E 6500 St S
- 8865 E 6500 St S
- 8888 E 6500 S
- 9385 E 4000 S
- 8889 E 6500 St S
- 9076 E 6000 S
- 9124 E 6125 S
- 8969 E 6500 St S
- 9732 E 6000 S
- 9190 E 6500 S
- 9750 E 6000 S
- 8850 E 6000 S
Your Personal Tour Guide
Ask me questions while you tour the home.