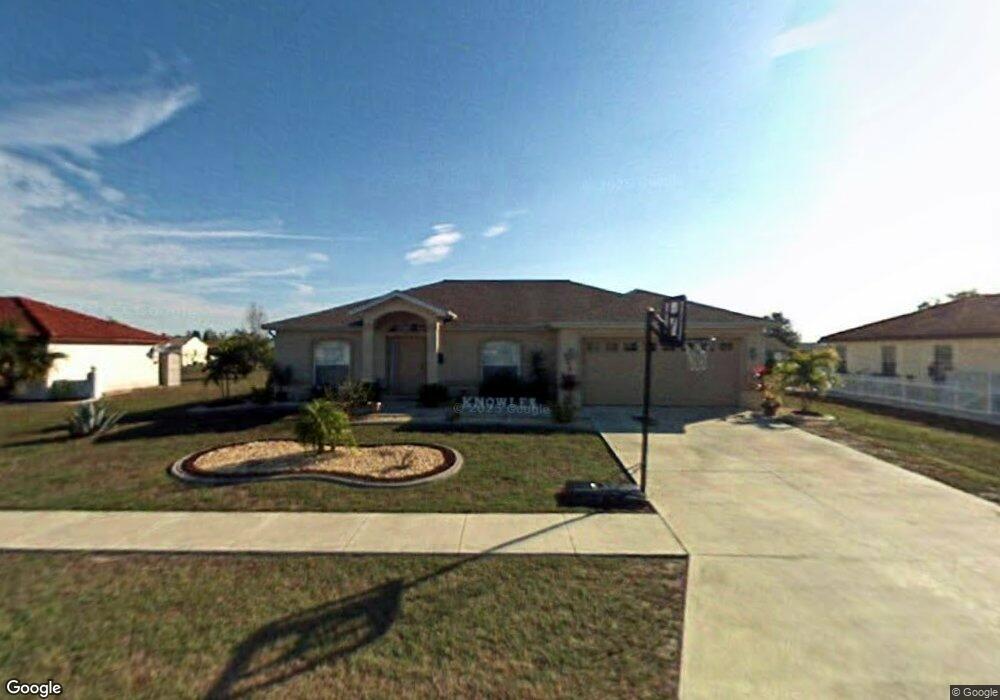
6276 Thorman Rd Port Charlotte, FL 33981
Gulf Cove NeighborhoodEstimated Value: $223,000 - $266,000
3
Beds
2
Baths
1,928
Sq Ft
$123/Sq Ft
Est. Value
About This Home
This home is located at 6276 Thorman Rd, Port Charlotte, FL 33981 and is currently estimated at $237,875, approximately $123 per square foot. 6276 Thorman Rd is a home located in Charlotte County with nearby schools including Myakka River Elementary School, L.A. Ainger Middle School, and Lemon Bay High School.
Ownership History
Date
Name
Owned For
Owner Type
Purchase Details
Closed on
Aug 11, 2010
Sold by
U S Bank National Association
Bought by
Szewczyk Peter and Szewczyk Myra I
Current Estimated Value
Purchase Details
Closed on
Jun 2, 2010
Sold by
Knowles Thomas and Knowles Teri
Bought by
U S Bank National Association
Purchase Details
Closed on
Jun 30, 2005
Sold by
Colatrella John T
Bought by
Knowles Thomas J and Knowles Teri S
Home Financials for this Owner
Home Financials are based on the most recent Mortgage that was taken out on this home.
Original Mortgage
$162,240
Interest Rate
5.7%
Mortgage Type
Unknown
Purchase Details
Closed on
Jan 12, 2001
Sold by
Allstate Bldr Sw Fl Inc
Bought by
Colatrella John T
Home Financials for this Owner
Home Financials are based on the most recent Mortgage that was taken out on this home.
Original Mortgage
$99,900
Interest Rate
7.53%
Purchase Details
Closed on
Dec 14, 1999
Sold by
T N R Co Inc
Bought by
Allstate Bldr Of Sw Fl Inc
Create a Home Valuation Report for This Property
The Home Valuation Report is an in-depth analysis detailing your home's value as well as a comparison with similar homes in the area
Home Values in the Area
Average Home Value in this Area
Purchase History
| Date | Buyer | Sale Price | Title Company |
|---|---|---|---|
| Szewczyk Peter | $70,000 | Rels Title | |
| U S Bank National Association | $58,800 | None Available | |
| Knowles Thomas J | $202,900 | Aaction Title Agency Inc | |
| Colatrella John T | $111,000 | -- | |
| Allstate Bldr Of Sw Fl Inc | $7,500 | -- |
Source: Public Records
Mortgage History
| Date | Status | Borrower | Loan Amount |
|---|---|---|---|
| Previous Owner | Knowles Thomas J | $162,240 | |
| Previous Owner | Colatrella John T | $99,900 |
Source: Public Records
Tax History Compared to Growth
Tax History
| Year | Tax Paid | Tax Assessment Tax Assessment Total Assessment is a certain percentage of the fair market value that is determined by local assessors to be the total taxable value of land and additions on the property. | Land | Improvement |
|---|---|---|---|---|
| 2023 | $3,909 | $157,255 | $0 | $0 |
| 2022 | $3,427 | $183,561 | $19,550 | $164,011 |
| 2021 | $3,025 | $129,963 | $10,625 | $119,338 |
| 2020 | $2,871 | $121,812 | $10,200 | $111,612 |
| 2019 | $2,777 | $118,546 | $10,200 | $108,346 |
| 2018 | $2,320 | $117,331 | $10,200 | $107,131 |
| 2017 | $2,207 | $111,288 | $6,715 | $104,573 |
| 2016 | $2,064 | $89,129 | $0 | $0 |
| 2015 | $1,861 | $81,026 | $0 | $0 |
| 2014 | $1,952 | $84,427 | $0 | $0 |
Source: Public Records
Map
Nearby Homes
- 6294 Thorman Rd
- 6322 Thorman Rd
- 6415 Coliseum Blvd
- 13450 Bennett Dr
- 6191 Drucker Cir
- 13477 Martha Ave
- 13525 Dibella Ave
- 6219 Coliseum Blvd
- 13482 Darnell Ave
- 13540 Dibella Ave
- 13384 Darnell Ave
- 13366 Bronze Ave
- 13367 Darnell Ave
- 13532 Romford Ave
- 13375 Bronze Ave
- 13463 Longwood Ave
- 13366 Ballon Ave
- 6113 Mckee St
- 13360 Foresman Blvd
- 6178 Coliseum Blvd
- 6268 Thorman Rd
- 6282 Thorman Rd
- 6399 Coliseum Blvd
- 6269 Thorman Rd
- 6389 Coliseum Blvd
- 6407 Coliseum Blvd
- 6260 Thorman Rd
- 6288 Thorman Rd
- 6277 Thorman Rd
- 6285 Thorman Rd
- 6379 Coliseum Blvd
- 6261 Thorman Rd
- 6252 Thorman Rd
- 6369 Coliseum Blvd
- 6423 Coliseum Blvd
- 6253 Thorman Rd
- 6293 Thorman Rd
- 13464 Buckett Cir
- 6392 Coliseum Blvd