Estimated Value: $227,000 - $315,000
3
Beds
2
Baths
900
Sq Ft
$304/Sq Ft
Est. Value
About This Home
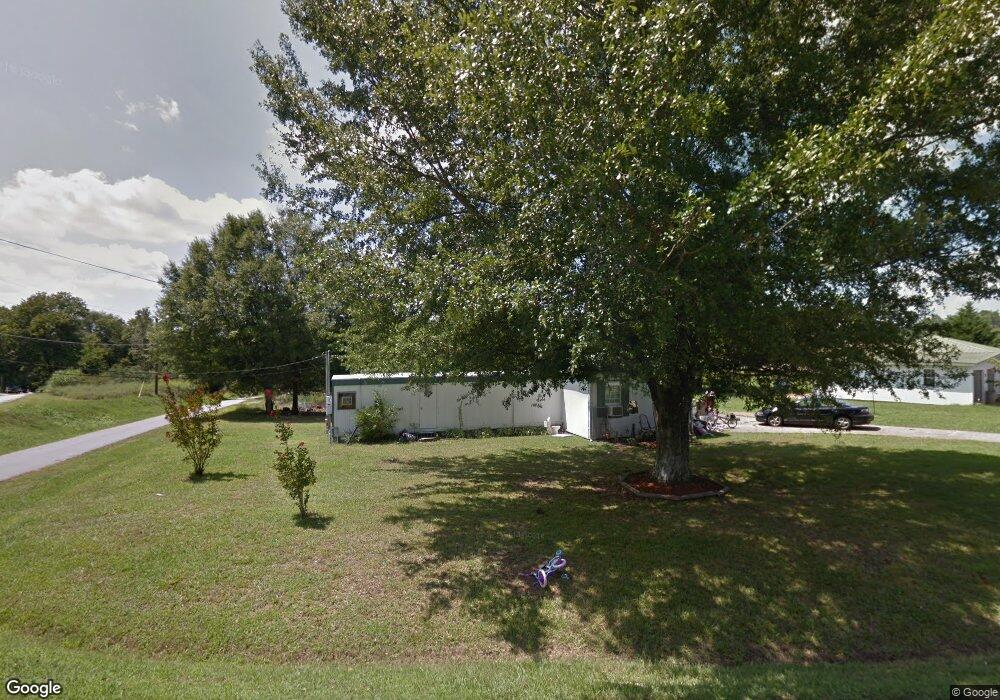
This home is located at 6278 County Line Rd, Lula, GA 30554 and is currently estimated at $273,641, approximately $304 per square foot. 6278 County Line Rd is a home with nearby schools including Lula Elementary School, East Hall Middle School, and East Hall High School.
Ownership History
Date
Name
Owned For
Owner Type
Purchase Details
Closed on
Jun 30, 2021
Sold by
Wragg Matthew
Bought by
Harper Margo Annette and Harper Jackie Henderson
Current Estimated Value
Home Financials for this Owner
Home Financials are based on the most recent Mortgage that was taken out on this home.
Original Mortgage
$201,286
Outstanding Balance
$181,444
Interest Rate
2.9%
Mortgage Type
FHA
Estimated Equity
$92,197
Purchase Details
Closed on
May 3, 2021
Sold by
Turner Allen
Bought by
Wragg Matthew
Home Financials for this Owner
Home Financials are based on the most recent Mortgage that was taken out on this home.
Original Mortgage
$201,286
Outstanding Balance
$181,444
Interest Rate
2.9%
Mortgage Type
FHA
Estimated Equity
$92,197
Purchase Details
Closed on
Sep 11, 2020
Sold by
Mcclure Laverne G
Bought by
Turner Allen
Purchase Details
Closed on
Jul 15, 2008
Sold by
Hawkins Esther G
Bought by
Mcclure Donald A and Mcclure Laverne G
Create a Home Valuation Report for This Property
The Home Valuation Report is an in-depth analysis detailing your home's value as well as a comparison with similar homes in the area
Home Values in the Area
Average Home Value in this Area
Purchase History
| Date | Buyer | Sale Price | Title Company |
|---|---|---|---|
| Harper Margo Annette | $205,000 | -- | |
| Wragg Matthew | $26,000 | -- | |
| Turner Allen | $10,500 | -- | |
| Mcclure Donald A | $20,000 | -- |
Source: Public Records
Mortgage History
| Date | Status | Borrower | Loan Amount |
|---|---|---|---|
| Open | Harper Margo Annette | $201,286 |
Source: Public Records
Tax History Compared to Growth
Tax History
| Year | Tax Paid | Tax Assessment Tax Assessment Total Assessment is a certain percentage of the fair market value that is determined by local assessors to be the total taxable value of land and additions on the property. | Land | Improvement |
|---|---|---|---|---|
| 2025 | $2,220 | $110,000 | $6,760 | $103,240 |
| 2024 | $2,289 | $93,120 | $7,120 | $86,000 |
| 2023 | $1,876 | $93,280 | $7,120 | $86,160 |
| 2022 | $2,054 | $80,480 | $7,120 | $73,360 |
| 2021 | $112 | $8,872 | $5,280 | $3,592 |
| 2020 | $243 | $8,872 | $5,280 | $3,592 |
| 2019 | $245 | $8,872 | $5,280 | $3,592 |
| 2018 | $254 | $8,872 | $5,280 | $3,592 |
| 2017 | $260 | $8,872 | $5,280 | $3,592 |
| 2016 | $181 | $6,312 | $3,120 | $3,192 |
| 2015 | $182 | $6,312 | $3,120 | $3,192 |
| 2014 | $182 | $6,312 | $3,120 | $3,192 |
Source: Public Records
Map
Nearby Homes
- 5867 Main St
- 6253 Main St
- 6108 Carter St
- 6385 Pine Station Dr
- 6455 Main St
- 142 Hampton St
- 6041 Cobb St
- 0 Caudell Dr Unit 7642531
- 0 Caudell Dr Unit 10596149
- 6334 Pine Ridge Point
- 163 Brookside Dr
- 131 Caudell Dr
- 5563 Pine St
- 131 Dr
- 5609 Oconee St
- 6713 E Wind Dr
- 6668 Belton Bridge Rd
- 6805 Belton Bridge Place
- 4920 Cornelia Hwy
- 5343 Morgan Manor Dr
- 6209 Helen St
- 6304 County Line Rd
- 6303 W County Line Rd
- 6217 Helen St
- 6045 Mill Rd
- 6037 Maiden Ln
- 6267 W County Line Rd
- 6214 Helen St
- 6033 Mill Rd
- 6316 County Line Rd
- 6030 Maiden Ln
- 6037 Mill Rd
- 0 Helen St Unit 8788496
- 0 Helen St
- 6029 Maiden Ln
- 6024 Maiden Ln
- 6023 Maiden Ln
- 6313 W County Line Rd
- 6018 Maiden Ln
- 6015 Mill St