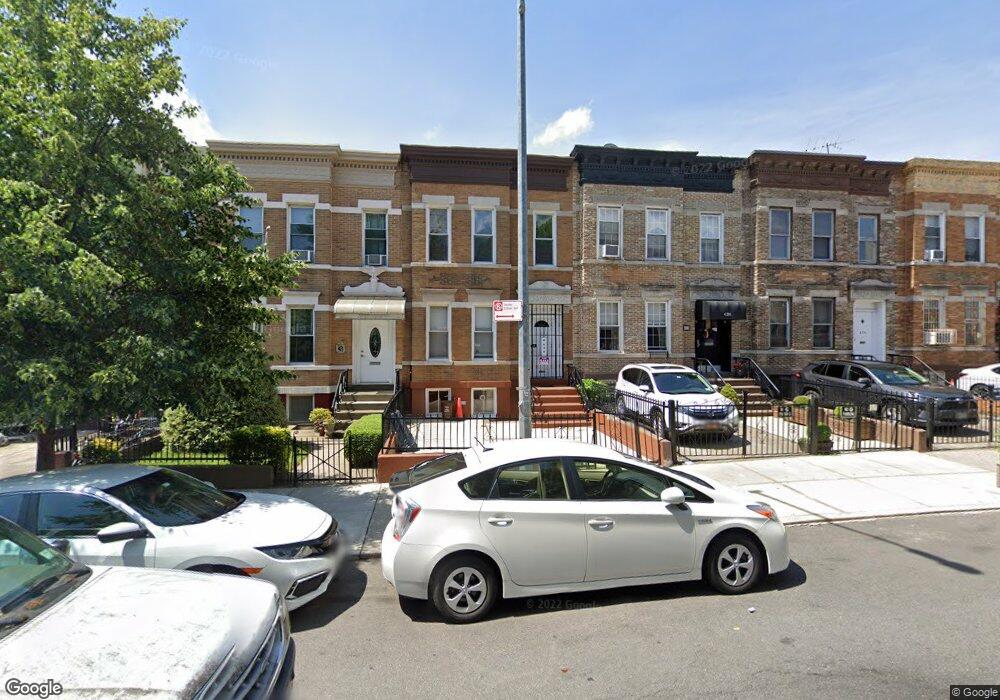
628 47th St Unit House Brooklyn, NY 11220
Sunset Park NeighborhoodEstimated Value: $1,325,762 - $1,478,000
--
Bed
2
Baths
1,872
Sq Ft
$762/Sq Ft
Est. Value
About This Home
This home is located at 628 47th St Unit House, Brooklyn, NY 11220 and is currently estimated at $1,426,941, approximately $762 per square foot. 628 47th St Unit House is a home located in Kings County with nearby schools including P.S. 169 Sunset Park, IS 220 John J. Pershing, and Leep Dual Language Academy Charter School.
Ownership History
Date
Name
Owned For
Owner Type
Purchase Details
Closed on
Jul 14, 2022
Sold by
Pagan Mirta and Silverhardt Mirta
Bought by
Lian Fengqin and Yang Yuan Hong
Current Estimated Value
Purchase Details
Closed on
Apr 1, 1993
Sold by
Pagan Rigoberto
Bought by
Pagan Mirta
Home Financials for this Owner
Home Financials are based on the most recent Mortgage that was taken out on this home.
Original Mortgage
$52,000
Interest Rate
8.5%
Create a Home Valuation Report for This Property
The Home Valuation Report is an in-depth analysis detailing your home's value as well as a comparison with similar homes in the area
Home Values in the Area
Average Home Value in this Area
Purchase History
| Date | Buyer | Sale Price | Title Company |
|---|---|---|---|
| Lian Fengqin | $1,320,000 | -- | |
| Lian Fengqin | $1,320,000 | -- | |
| Pagan Mirta | -- | Commonwealth Land Title Ins | |
| Pagan Mirta | -- | Commonwealth Land Title Ins |
Source: Public Records
Mortgage History
| Date | Status | Borrower | Loan Amount |
|---|---|---|---|
| Previous Owner | Pagan Mirta | $52,000 |
Source: Public Records
Tax History Compared to Growth
Tax History
| Year | Tax Paid | Tax Assessment Tax Assessment Total Assessment is a certain percentage of the fair market value that is determined by local assessors to be the total taxable value of land and additions on the property. | Land | Improvement |
|---|---|---|---|---|
| 2025 | $7,340 | $77,220 | $25,560 | $51,660 |
| 2024 | $7,340 | $73,800 | $25,560 | $48,240 |
| 2023 | $7,422 | $87,600 | $25,560 | $62,040 |
| 2022 | $6,579 | $82,500 | $25,560 | $56,940 |
| 2021 | $6,540 | $75,960 | $25,560 | $50,400 |
| 2020 | $4,905 | $79,140 | $25,560 | $53,580 |
| 2019 | $5,712 | $67,920 | $25,560 | $42,360 |
| 2018 | $5,549 | $30,456 | $12,114 | $18,342 |
| 2017 | $5,513 | $30,214 | $10,871 | $19,343 |
| 2016 | $5,389 | $28,507 | $11,610 | $16,897 |
| 2015 | $3,218 | $26,896 | $14,151 | $12,745 |
| 2014 | $3,218 | $25,380 | $15,043 | $10,337 |
Source: Public Records
Map
Nearby Homes