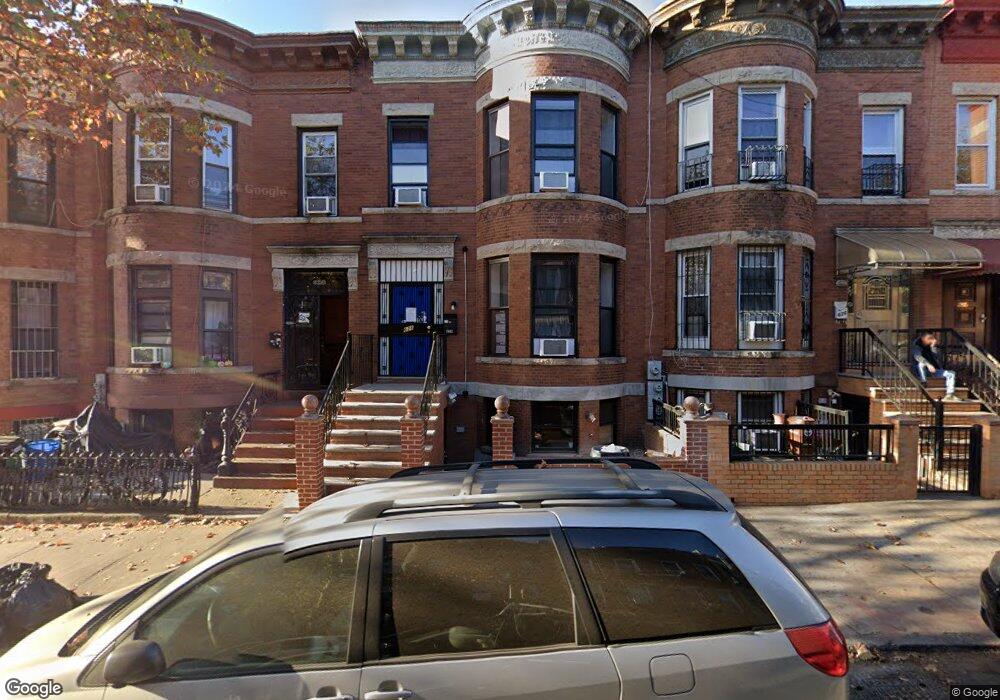
628 56th St Brooklyn, NY 11220
Sunset Park NeighborhoodEstimated Value: $1,658,942 - $1,798,000
7
Beds
3
Baths
3,162
Sq Ft
$543/Sq Ft
Est. Value
About This Home
This home is located at 628 56th St, Brooklyn, NY 11220 and is currently estimated at $1,717,986, approximately $543 per square foot. 628 56th St is a home located in Kings County with nearby schools including P.S. 105 The Blythebourne, IS 220 John J. Pershing, and Fort Hamilton High School.
Ownership History
Date
Name
Owned For
Owner Type
Purchase Details
Closed on
Mar 11, 2024
Sold by
Walsh John J
Bought by
Gao Xiao Yun and Wen Xiao Qin
Current Estimated Value
Home Financials for this Owner
Home Financials are based on the most recent Mortgage that was taken out on this home.
Original Mortgage
$824,500
Outstanding Balance
$809,984
Interest Rate
6.63%
Mortgage Type
Purchase Money Mortgage
Estimated Equity
$908,002
Purchase Details
Closed on
Mar 3, 2004
Sold by
George Evelyn and Warren Lutocka As Executor
Bought by
Walsh John J
Create a Home Valuation Report for This Property
The Home Valuation Report is an in-depth analysis detailing your home's value as well as a comparison with similar homes in the area
Home Values in the Area
Average Home Value in this Area
Purchase History
| Date | Buyer | Sale Price | Title Company |
|---|---|---|---|
| Gao Xiao Yun | $1,649,000 | -- | |
| Gao Xiao Yun | $1,649,000 | -- | |
| Walsh John J | $550,000 | -- | |
| Walsh John J | $550,000 | -- |
Source: Public Records
Mortgage History
| Date | Status | Borrower | Loan Amount |
|---|---|---|---|
| Open | Gao Xiao Yun | $824,500 | |
| Closed | Gao Xiao Yun | $824,500 |
Source: Public Records
Tax History
| Year | Tax Paid | Tax Assessment Tax Assessment Total Assessment is a certain percentage of the fair market value that is determined by local assessors to be the total taxable value of land and additions on the property. | Land | Improvement |
|---|---|---|---|---|
| 2025 | $8,391 | $100,980 | $25,680 | $75,300 |
| 2024 | $8,391 | $105,240 | $25,680 | $79,560 |
| 2023 | $8,004 | $104,040 | $25,680 | $78,360 |
| 2022 | $7,590 | $85,320 | $25,680 | $59,640 |
| 2021 | $8,001 | $93,600 | $25,680 | $67,920 |
| 2020 | $3,861 | $94,680 | $25,680 | $69,000 |
| 2019 | $7,283 | $91,800 | $25,680 | $66,120 |
| 2018 | $6,695 | $32,844 | $8,288 | $24,556 |
| 2017 | $6,459 | $31,683 | $12,614 | $19,069 |
| 2016 | $6,334 | $31,683 | $12,853 | $18,830 |
| 2015 | $3,605 | $30,752 | $14,018 | $16,734 |
| 2014 | $3,605 | $29,012 | $13,920 | $15,092 |
Source: Public Records
Map
Nearby Homes
Your Personal Tour Guide
Ask me questions while you tour the home.