628 5th Ave Albany, GA 31701
Rawson Park NeighborhoodEstimated Value: $124,832 - $201,000
3
Beds
2
Baths
1,116
Sq Ft
$141/Sq Ft
Est. Value
About This Home
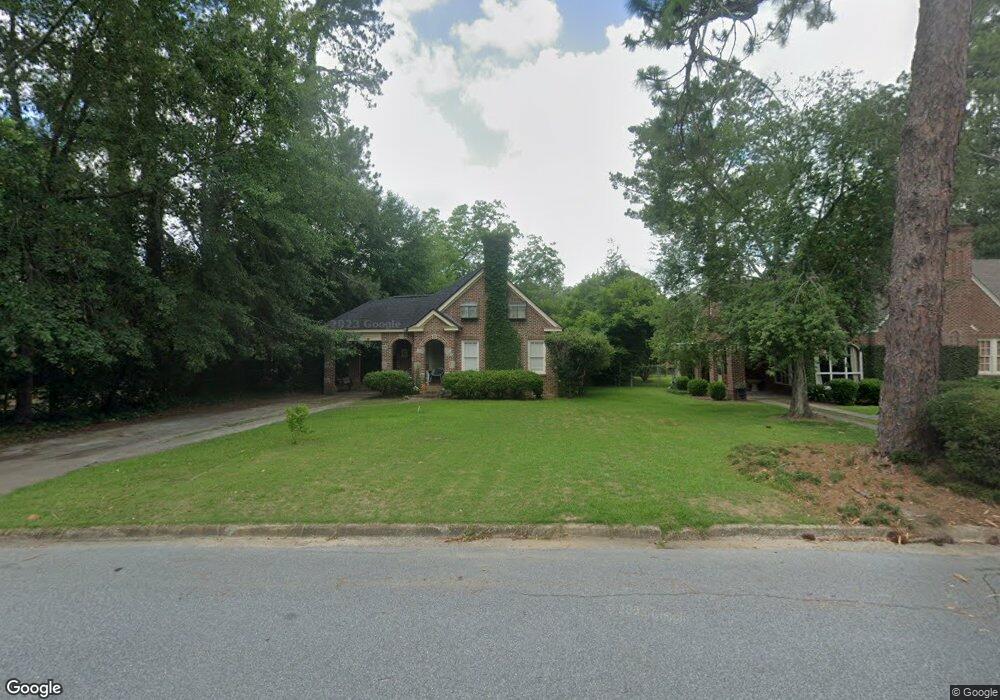
This home is located at 628 5th Ave, Albany, GA 31701 and is currently estimated at $157,708, approximately $141 per square foot. 628 5th Ave is a home located in Dougherty County with nearby schools including Northside Elementary School, Albany Middle School, and Albany High School.
Ownership History
Date
Name
Owned For
Owner Type
Purchase Details
Closed on
May 28, 2024
Sold by
Davis Yolanda
Bought by
Lee Jennifer G and Lee John B
Current Estimated Value
Home Financials for this Owner
Home Financials are based on the most recent Mortgage that was taken out on this home.
Original Mortgage
$109,998
Outstanding Balance
$108,647
Interest Rate
7.22%
Mortgage Type
New Conventional
Estimated Equity
$49,061
Purchase Details
Closed on
Dec 8, 2005
Sold by
Vaknin Joseph
Bought by
Davis Yolanda M
Purchase Details
Closed on
Dec 21, 2004
Sold by
Rhyne Walter Y
Bought by
Vaknin Joseph and Vaknin Jacob
Purchase Details
Closed on
Jan 1, 1984
Sold by
Bass George D
Bought by
Rhyne Walter Y
Create a Home Valuation Report for This Property
The Home Valuation Report is an in-depth analysis detailing your home's value as well as a comparison with similar homes in the area
Home Values in the Area
Average Home Value in this Area
Purchase History
| Date | Buyer | Sale Price | Title Company |
|---|---|---|---|
| Lee Jennifer G | $113,400 | -- | |
| Davis Yolanda M | $128,000 | -- | |
| Vaknin Joseph | $80,500 | -- | |
| Rhyne Walter Y | -- | -- |
Source: Public Records
Mortgage History
| Date | Status | Borrower | Loan Amount |
|---|---|---|---|
| Open | Lee Jennifer G | $109,998 |
Source: Public Records
Tax History Compared to Growth
Tax History
| Year | Tax Paid | Tax Assessment Tax Assessment Total Assessment is a certain percentage of the fair market value that is determined by local assessors to be the total taxable value of land and additions on the property. | Land | Improvement |
|---|---|---|---|---|
| 2024 | $1,532 | $32,120 | $6,320 | $25,800 |
| 2023 | $1,496 | $32,120 | $6,320 | $25,800 |
| 2022 | $1,502 | $32,120 | $6,320 | $25,800 |
| 2021 | $1,393 | $32,120 | $6,320 | $25,800 |
| 2020 | $1,396 | $32,120 | $6,320 | $25,800 |
| 2019 | $1,401 | $32,120 | $6,320 | $25,800 |
| 2018 | $1,407 | $32,120 | $6,320 | $25,800 |
| 2017 | $1,229 | $32,120 | $6,320 | $25,800 |
| 2016 | $1,230 | $32,120 | $6,320 | $25,800 |
| 2015 | $1,233 | $32,120 | $6,320 | $25,800 |
| 2014 | $1,266 | $33,320 | $7,520 | $25,800 |
Source: Public Records
Map
Nearby Homes