
Seller's Agent in 2025
Teresa Simkins
Coldwell Banker Brock Realty
(229) 220-4546
144 Total Sales
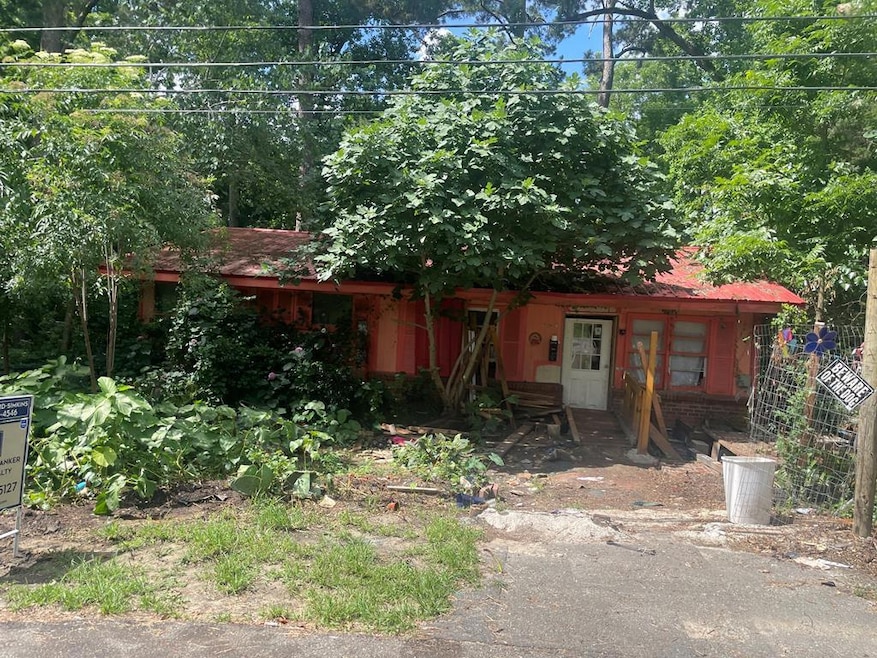
Home sold as-is. Needs work
Last Agent to Sell the Property
Coldwell Banker Brock Realty Brokerage Phone: 2292465127 License #157600 Listed on: 06/13/2025
Last Buyer's Agent
Coldwell Banker Brock Realty Brokerage Phone: 2292465127 License #157600 Listed on: 06/13/2025
| Date | Type | Sale Price | Title Company |
|---|---|---|---|
| Quit Claim Deed | $15,000 | -- | |
| Warranty Deed | -- | -- | |
| Warranty Deed | -- | -- | |
| Gift Deed | -- | -- | |
| Deed | $8,186 | -- | |
| Deed | -- | -- | |
| Deed | $7,000 | -- | |
| Deed | -- | -- | |
| Deed | $30,000 | -- | |
| Deed | $27,000 | -- | |
| Deed | $27,500 | -- |
| Date | Event | Price | List to Sale | Price per Sq Ft |
|---|---|---|---|---|
| 07/03/2025 07/03/25 | Sold | $15,000 | -57.1% | $11 / Sq Ft |
| 06/30/2025 06/30/25 | Pending | -- | -- | -- |
| 06/13/2025 06/13/25 | For Sale | $35,000 | -- | $26 / Sq Ft |
| Year | Tax Paid | Tax Assessment Tax Assessment Total Assessment is a certain percentage of the fair market value that is determined by local assessors to be the total taxable value of land and additions on the property. | Land | Improvement |
|---|---|---|---|---|
| 2025 | $284 | $19,354 | $2,000 | $17,354 |
| 2024 | $284 | $17,680 | $2,000 | $15,680 |
| 2023 | $78 | $6,250 | $1,296 | $4,954 |
| 2022 | $87 | $6,250 | $1,296 | $4,954 |
| 2021 | $87 | $6,250 | $1,296 | $4,954 |
| 2020 | $87 | $6,250 | $1,296 | $4,954 |
| 2019 | $87 | $6,250 | $1,296 | $4,954 |
| 2018 | $83 | $6,392 | $1,296 | $5,096 |
| 2017 | $226 | $6,392 | $1,296 | $5,096 |
| 2016 | $197 | $5,440 | $1,296 | $4,144 |
| 2015 | $195 | $5,440 | $1,296 | $4,144 |
| 2014 | $195 | $5,440 | $1,296 | $4,144 |
| 2013 | -- | $4,918 | $1,296 | $3,622 |
Seller's Agent in 2025
Teresa Simkins
Coldwell Banker Brock Realty
(229) 220-4546
144 Total Sales
Source: Southwest Georgia Board of REALTORS®
MLS Number: 14063
APN: C0340-00000-100-000
Ask me questions while you tour the home.