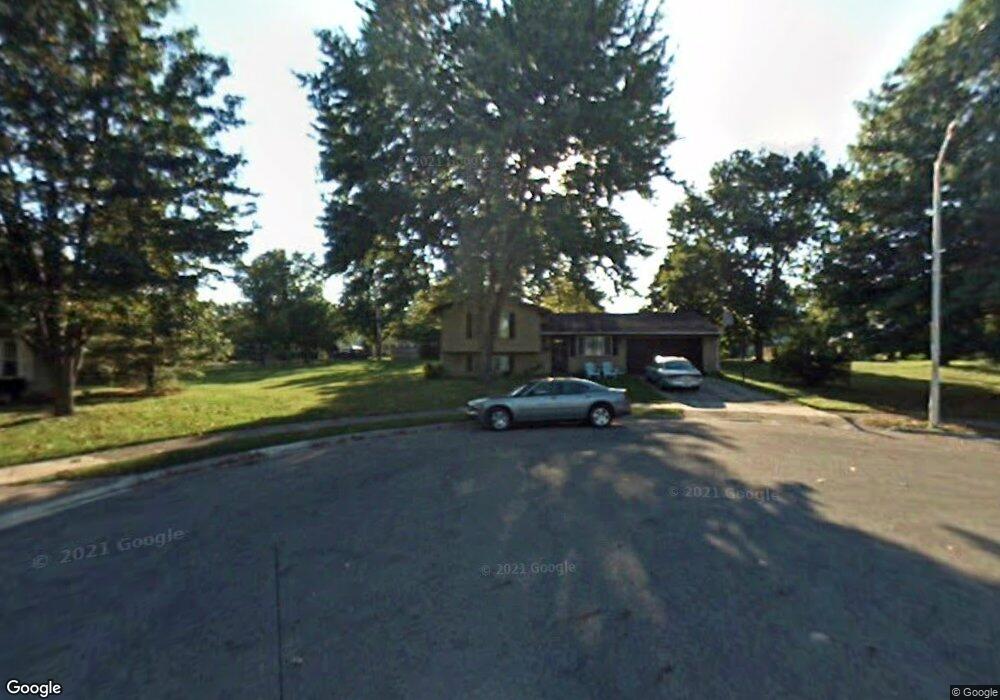
628 Burns Ct Westerville, OH 43081
Estimated Value: $341,000 - $378,000
3
Beds
2
Baths
1,382
Sq Ft
$260/Sq Ft
Est. Value
About This Home
This home is located at 628 Burns Ct, Westerville, OH 43081 and is currently estimated at $360,004, approximately $260 per square foot. 628 Burns Ct is a home located in Franklin County with nearby schools including Robert Frost Elementary School, Heritage Middle School, and Westerville-North High School.
Ownership History
Date
Name
Owned For
Owner Type
Purchase Details
Closed on
Aug 30, 2017
Sold by
Pietrangelo Gary P and Pietrangelo Debra R
Bought by
Hess Kelly N
Current Estimated Value
Home Financials for this Owner
Home Financials are based on the most recent Mortgage that was taken out on this home.
Original Mortgage
$108,000
Outstanding Balance
$89,393
Interest Rate
3.93%
Mortgage Type
New Conventional
Estimated Equity
$270,611
Purchase Details
Closed on
Feb 18, 1977
Bought by
Pietrangelo Gary P
Create a Home Valuation Report for This Property
The Home Valuation Report is an in-depth analysis detailing your home's value as well as a comparison with similar homes in the area
Home Values in the Area
Average Home Value in this Area
Purchase History
| Date | Buyer | Sale Price | Title Company |
|---|---|---|---|
| Hess Kelly N | $120,000 | None Available | |
| Pietrangelo Gary P | -- | -- |
Source: Public Records
Mortgage History
| Date | Status | Borrower | Loan Amount |
|---|---|---|---|
| Open | Hess Kelly N | $108,000 |
Source: Public Records
Tax History
| Year | Tax Paid | Tax Assessment Tax Assessment Total Assessment is a certain percentage of the fair market value that is determined by local assessors to be the total taxable value of land and additions on the property. | Land | Improvement |
|---|---|---|---|---|
| 2025 | $6,286 | $110,610 | $32,730 | $77,880 |
| 2024 | $6,286 | $110,610 | $32,730 | $77,880 |
| 2023 | $6,153 | $110,600 | $32,725 | $77,875 |
| 2022 | $5,506 | $75,570 | $15,750 | $59,820 |
| 2021 | $5,552 | $75,570 | $15,750 | $59,820 |
| 2020 | $5,536 | $75,570 | $15,750 | $59,820 |
| 2019 | $4,707 | $60,660 | $15,750 | $44,910 |
| 2018 | $3,712 | $41,020 | $15,750 | $25,270 |
| 2017 | $3,217 | $41,020 | $15,750 | $25,270 |
| 2016 | $4,439 | $51,520 | $17,080 | $34,440 |
| 2015 | $4,303 | $51,520 | $17,080 | $34,440 |
| 2014 | $4,306 | $51,520 | $17,080 | $34,440 |
| 2013 | $1,991 | $49,070 | $16,275 | $32,795 |
Source: Public Records
Map
Nearby Homes
- 629 Andrew Ave
- 138 Wood St
- 687 E College Ave
- 852 Karen Ct
- 393 Canterbury Ct
- 960 Lakeland Dr
- 339 Aylesbury Dr S
- 328 Myrtle Dr Unit Lot 5
- 348 Myrtle Dr Unit Lot 10
- 337 Myrtle Dr Unit Lot 2
- 334 Myrtle Dr Unit Lot 7
- 342 Myrtle Dr Unit Lot 8
- 344 Myrtle Dr Unit Lot 9
- 373 Wyndham Park S
- 303 Pointe Place
- 291 Pointe Place
- 961 E College Ave
- 660 Albion Place Unit 8660
- 266 Black Walnut Dr
- 787 Centerpark Dr
Your Personal Tour Guide
Ask me questions while you tour the home.