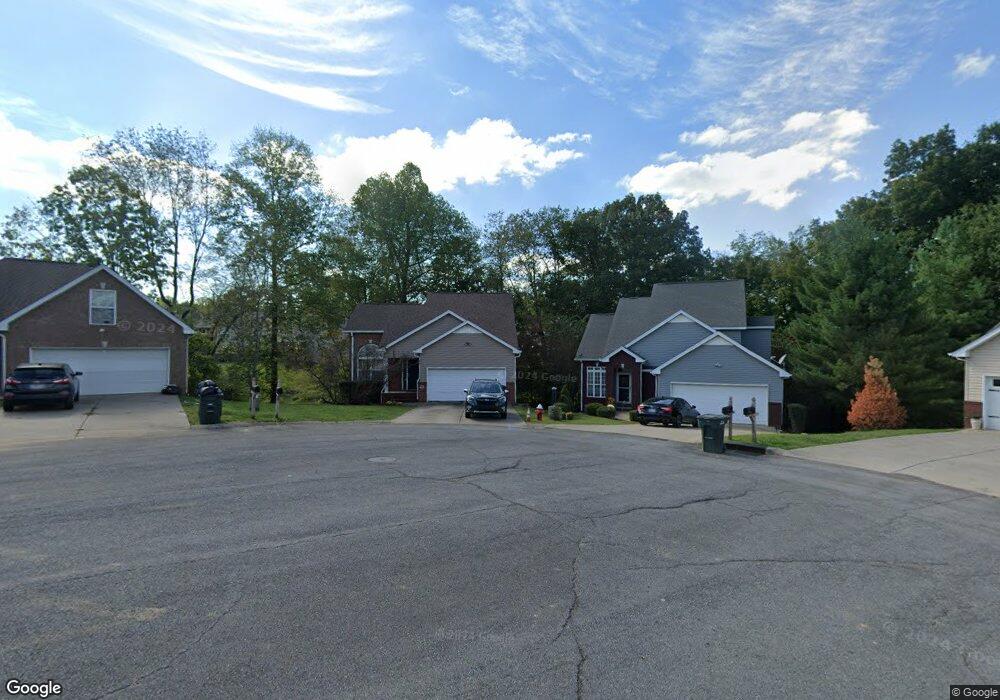
628 Chestnut Ct Springfield, TN 37172
Estimated Value: $276,000 - $327,000
Studio
2
Baths
1,496
Sq Ft
$201/Sq Ft
Est. Value
About This Home
This home is located at 628 Chestnut Ct, Springfield, TN 37172 and is currently estimated at $299,985, approximately $200 per square foot. 628 Chestnut Ct is a home located in Robertson County with nearby schools including Westside Elementary School, Cheatham Park Elementary School, and Jo Byrns High School.
Ownership History
Date
Name
Owned For
Owner Type
Purchase Details
Closed on
Sep 6, 2005
Sold by
Green Springfield
Bought by
Bryant Franklin D and Ma Anne
Current Estimated Value
Home Financials for this Owner
Home Financials are based on the most recent Mortgage that was taken out on this home.
Original Mortgage
$142,037
Outstanding Balance
$75,101
Interest Rate
5.86%
Mortgage Type
VA
Estimated Equity
$224,884
Purchase Details
Closed on
Aug 17, 2005
Sold by
Green Springfield
Bought by
Burnett Home Builders Inc
Home Financials for this Owner
Home Financials are based on the most recent Mortgage that was taken out on this home.
Original Mortgage
$142,037
Outstanding Balance
$75,101
Interest Rate
5.86%
Mortgage Type
VA
Estimated Equity
$224,884
Create a Home Valuation Report for This Property
The Home Valuation Report is an in-depth analysis detailing your home's value as well as a comparison with similar homes in the area
Home Values in the Area
Average Home Value in this Area
Purchase History
| Date | Buyer | Sale Price | Title Company |
|---|---|---|---|
| Bryant Franklin D | $137,500 | -- | |
| Burnett Home Builders Inc | $19,700 | -- |
Source: Public Records
Mortgage History
| Date | Status | Borrower | Loan Amount |
|---|---|---|---|
| Open | Burnett Home Builders Inc | $142,037 | |
| Closed | Burnett Home Builders Inc | $142,037 |
Source: Public Records
Tax History
| Year | Tax Paid | Tax Assessment Tax Assessment Total Assessment is a certain percentage of the fair market value that is determined by local assessors to be the total taxable value of land and additions on the property. | Land | Improvement |
|---|---|---|---|---|
| 2025 | -- | $73,650 | $13,750 | $59,900 |
| 2024 | -- | $73,650 | $13,750 | $59,900 |
| 2023 | $1,845 | $73,650 | $13,750 | $59,900 |
| 2022 | $1,675 | $45,925 | $6,200 | $39,725 |
| 2021 | $1,592 | $43,625 | $6,200 | $37,425 |
| 2020 | $1,592 | $43,625 | $6,200 | $37,425 |
| 2019 | $47,924 | $43,625 | $6,200 | $37,425 |
| 2018 | $1,592 | $43,625 | $6,200 | $37,425 |
| 2017 | $1,581 | $36,900 | $5,500 | $31,400 |
| 2016 | $1,581 | $36,900 | $5,500 | $31,400 |
| 2015 | $1,535 | $36,900 | $5,500 | $31,400 |
| 2014 | $1,535 | $36,900 | $5,500 | $31,400 |
Source: Public Records
Map
Nearby Homes
Your Personal Tour Guide
Ask me questions while you tour the home.