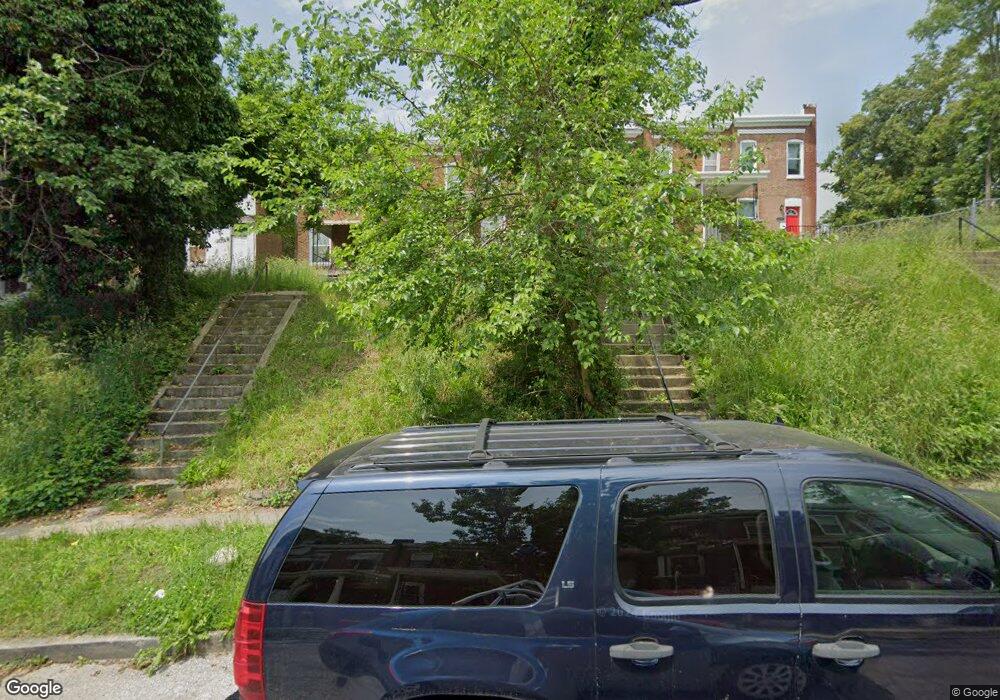
628 Denison St Baltimore, MD 21229
Edmondson Villiage NeighborhoodEstimated Value: $171,000 - $254,389
3
Beds
2
Baths
--
Sq Ft
--
Built
About This Home
This home is located at 628 Denison St, Baltimore, MD 21229 and is currently estimated at $212,695. 628 Denison St is a home located in Baltimore City with nearby schools including Mary E. Rodman Elementary School, Booker T. Washington Middle School, and Frederick Douglass High School.
Ownership History
Date
Name
Owned For
Owner Type
Purchase Details
Closed on
Feb 16, 2011
Sold by
Eh Pooled 510 Lp
Bought by
Davos Korner Llc
Current Estimated Value
Purchase Details
Closed on
Oct 30, 2009
Sold by
Brown Dale
Bought by
Homesales Inc
Purchase Details
Closed on
Jan 4, 2008
Sold by
Summers & Associates
Bought by
Brown Dale
Home Financials for this Owner
Home Financials are based on the most recent Mortgage that was taken out on this home.
Original Mortgage
$128,250
Interest Rate
6.48%
Mortgage Type
New Conventional
Purchase Details
Closed on
Jun 4, 2001
Sold by
Secretary Of Housing & Urban
Bought by
Summers & Associates
Purchase Details
Closed on
Jun 27, 2000
Sold by
Coleman Donna M
Bought by
Countrywide Home Loans Inc
Purchase Details
Closed on
Aug 7, 1997
Sold by
Diplomat Realty Inc
Bought by
Coleman Donna M
Purchase Details
Closed on
Apr 16, 1997
Sold by
Griffin John R
Bought by
Diplomat Realty Inc
Create a Home Valuation Report for This Property
The Home Valuation Report is an in-depth analysis detailing your home's value as well as a comparison with similar homes in the area
Home Values in the Area
Average Home Value in this Area
Purchase History
| Date | Buyer | Sale Price | Title Company |
|---|---|---|---|
| Davos Korner Llc | $14,000 | -- | |
| Homesales Inc | $57,000 | -- | |
| Brown Dale | $135,000 | -- | |
| Summers & Associates | $6,000 | -- | |
| Countrywide Home Loans Inc | $50,000 | -- | |
| Coleman Donna M | $45,000 | -- | |
| Diplomat Realty Inc | $13,500 | -- |
Source: Public Records
Mortgage History
| Date | Status | Borrower | Loan Amount |
|---|---|---|---|
| Previous Owner | Brown Dale | $128,250 |
Source: Public Records
Tax History
| Year | Tax Paid | Tax Assessment Tax Assessment Total Assessment is a certain percentage of the fair market value that is determined by local assessors to be the total taxable value of land and additions on the property. | Land | Improvement |
|---|---|---|---|---|
| 2025 | $525 | $25,667 | -- | -- |
| 2024 | $525 | $22,333 | -- | -- |
| 2023 | $448 | $19,000 | $4,000 | $15,000 |
| 2022 | $433 | $18,333 | $0 | $0 |
| 2021 | $417 | $17,667 | $0 | $0 |
| 2020 | $401 | $17,000 | $4,000 | $13,000 |
| 2019 | $399 | $17,000 | $4,000 | $13,000 |
| 2018 | $401 | $17,000 | $4,000 | $13,000 |
| 2017 | $401 | $17,000 | $0 | $0 |
| 2016 | $640 | $17,000 | $0 | $0 |
| 2015 | $640 | $17,000 | $0 | $0 |
| 2014 | $640 | $27,000 | $0 | $0 |
Source: Public Records
Map
Nearby Homes
- 3503 Edmondson Ave
- 3526 Edmondson Ave
- 730 N Edgewood St
- 3530 Edmondson Ave
- 3335 Edmondson Ave
- 743 Linnard St
- 620 N Hilton St
- 726 N Grantley St
- 3410 W Franklin St
- 3404 W Franklin St
- 748 Denison St
- 3604 Harlem Ave
- 3606 Harlem Ave
- 3608 Harlem Ave
- 611 Allendale St
- 763 N Edgewood St
- 3306 W Franklin St
- 3645 Gelston Dr
- 3302 W Franklin St
- 3657 Gelston Dr
- 630 Denison St
- 626 Denison St
- 624 Denison St
- 632 Denison St
- 634 Denison St
- 622 Denison St
- 620 Denison St
- 614 Denison St
- 3421 Harlem Ave
- 612 Denison St
- 610 Denison St
- 608 Denison St
- 705 N Edgewood St
- 606 Denison St
- 627 Denison St
- 625 Denison St
- 629 Denison St
- 623 Denison St
- 631 Denison St
- 703 Edgewood St
Your Personal Tour Guide
Ask me questions while you tour the home.