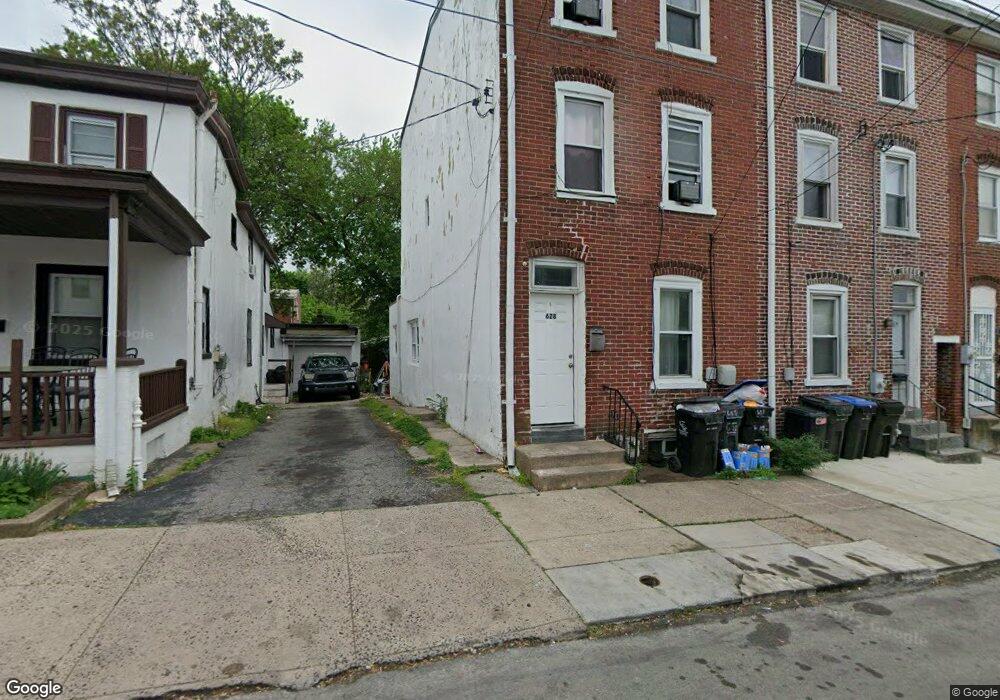
628 E Moore St Norristown, PA 19401
Estimated Value: $137,472 - $205,000
5
Beds
1
Bath
1,648
Sq Ft
$100/Sq Ft
Est. Value
About This Home
This home is located at 628 E Moore St, Norristown, PA 19401 and is currently estimated at $164,824, approximately $100 per square foot. 628 E Moore St is a home located in Montgomery County with nearby schools including Charles Blockson Middle School, Cole Manor Elementary School, and East Norriton Middle School.
Ownership History
Date
Name
Owned For
Owner Type
Purchase Details
Closed on
Dec 7, 2021
Sold by
Michael Grodanz
Bought by
Khan Maheen
Current Estimated Value
Purchase Details
Closed on
Apr 24, 2004
Sold by
Garst Vanessa
Bought by
Grodanz Michael
Home Financials for this Owner
Home Financials are based on the most recent Mortgage that was taken out on this home.
Original Mortgage
$52,800
Interest Rate
5.47%
Purchase Details
Closed on
Mar 19, 2004
Sold by
Petrillo Bruno and Petrillo Clorinda
Bought by
Garst Vanessa
Home Financials for this Owner
Home Financials are based on the most recent Mortgage that was taken out on this home.
Original Mortgage
$52,800
Interest Rate
5.47%
Purchase Details
Closed on
Nov 29, 1996
Sold by
Fowler Dina Cerasi and Cerasi Dina
Bought by
Petrillo Clorinda
Create a Home Valuation Report for This Property
The Home Valuation Report is an in-depth analysis detailing your home's value as well as a comparison with similar homes in the area
Home Values in the Area
Average Home Value in this Area
Purchase History
| Date | Buyer | Sale Price | Title Company |
|---|---|---|---|
| Khan Maheen | $90,000 | H&H Settlement Services Llc | |
| Grodanz Michael | $66,000 | -- | |
| Garst Vanessa | $61,400 | -- | |
| Petrillo Clorinda | $44,500 | -- |
Source: Public Records
Mortgage History
| Date | Status | Borrower | Loan Amount |
|---|---|---|---|
| Previous Owner | Grodanz Michael | $52,800 | |
| Previous Owner | Garst Vanessa | $55,260 |
Source: Public Records
Tax History Compared to Growth
Tax History
| Year | Tax Paid | Tax Assessment Tax Assessment Total Assessment is a certain percentage of the fair market value that is determined by local assessors to be the total taxable value of land and additions on the property. | Land | Improvement |
|---|---|---|---|---|
| 2025 | $2,732 | $44,500 | $21,200 | $23,300 |
| 2024 | $2,732 | $44,500 | $21,200 | $23,300 |
| 2023 | $2,708 | $44,500 | $21,200 | $23,300 |
| 2022 | $2,649 | $44,500 | $21,200 | $23,300 |
| 2021 | $2,636 | $44,500 | $21,200 | $23,300 |
| 2020 | $2,514 | $44,500 | $21,200 | $23,300 |
| 2019 | $2,468 | $44,500 | $21,200 | $23,300 |
| 2018 | $1,643 | $44,500 | $21,200 | $23,300 |
| 2017 | $2,267 | $44,500 | $21,200 | $23,300 |
| 2016 | $2,249 | $44,500 | $21,200 | $23,300 |
| 2015 | $2,154 | $44,500 | $21,200 | $23,300 |
| 2014 | $2,154 | $44,500 | $21,200 | $23,300 |
Source: Public Records
Map
Nearby Homes