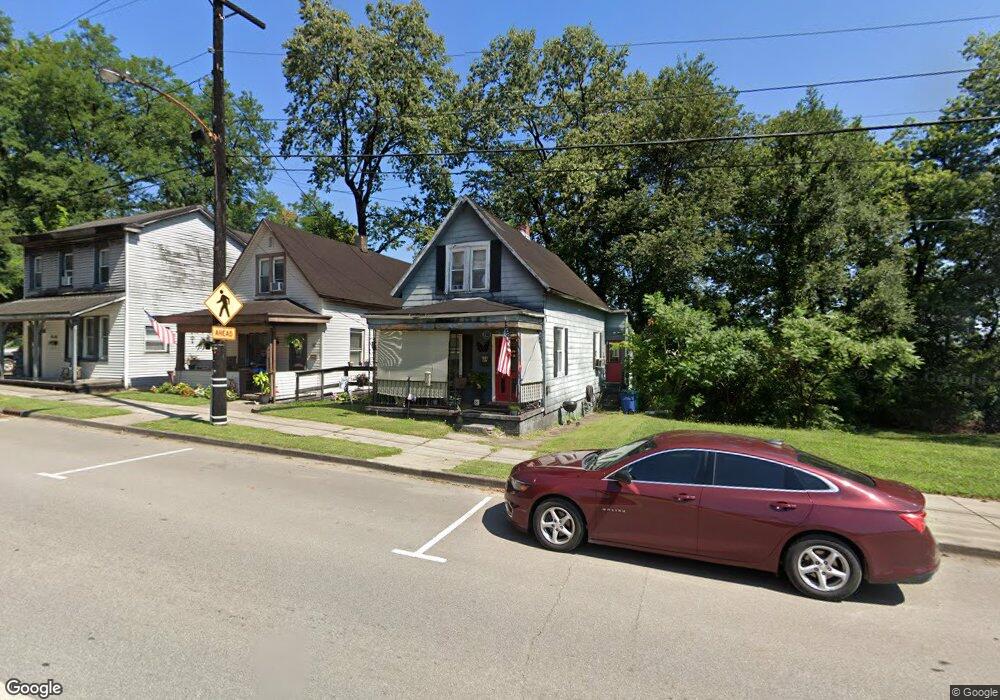
628 Main St Lawrenceburg, IN 47025
Estimated Value: $131,000 - $174,000
2
Beds
1
Bath
1,252
Sq Ft
$123/Sq Ft
Est. Value
About This Home
This home is located at 628 Main St, Lawrenceburg, IN 47025 and is currently estimated at $153,902, approximately $122 per square foot. 628 Main St is a home located in Dearborn County with nearby schools including Lawrenceburg Primary School, Central Elementary School, and Greendale Middle School.
Ownership History
Date
Name
Owned For
Owner Type
Purchase Details
Closed on
May 4, 2018
Sold by
Feller Angela L
Bought by
Feller Thomas
Current Estimated Value
Purchase Details
Closed on
Mar 6, 2007
Sold by
Jpmorgan Chase Bank
Bought by
Feller Angela L
Home Financials for this Owner
Home Financials are based on the most recent Mortgage that was taken out on this home.
Original Mortgage
$47,963
Interest Rate
6.2%
Mortgage Type
Stand Alone First
Purchase Details
Closed on
Sep 21, 2006
Sold by
Lusby David
Bought by
Jpmorgan Chase Bank
Create a Home Valuation Report for This Property
The Home Valuation Report is an in-depth analysis detailing your home's value as well as a comparison with similar homes in the area
Home Values in the Area
Average Home Value in this Area
Purchase History
| Date | Buyer | Sale Price | Title Company |
|---|---|---|---|
| Feller Thomas | -- | -- | |
| Feller Angela L | -- | -- | |
| Jpmorgan Chase Bank | $30,000 | -- |
Source: Public Records
Mortgage History
| Date | Status | Borrower | Loan Amount |
|---|---|---|---|
| Previous Owner | Feller Angela L | $47,963 |
Source: Public Records
Tax History Compared to Growth
Tax History
| Year | Tax Paid | Tax Assessment Tax Assessment Total Assessment is a certain percentage of the fair market value that is determined by local assessors to be the total taxable value of land and additions on the property. | Land | Improvement |
|---|---|---|---|---|
| 2024 | $546 | $67,400 | $8,800 | $58,600 |
| 2023 | $478 | $61,800 | $8,800 | $53,000 |
| 2022 | $497 | $63,000 | $8,800 | $54,200 |
| 2021 | $478 | $60,800 | $8,800 | $52,000 |
| 2020 | $446 | $60,800 | $8,800 | $52,000 |
| 2019 | $361 | $56,300 | $8,800 | $47,500 |
| 2018 | $415 | $63,900 | $8,800 | $55,100 |
| 2017 | $1,266 | $63,300 | $8,800 | $54,500 |
| 2016 | $1,266 | $63,300 | $8,800 | $54,500 |
| 2014 | $1,448 | $72,400 | $8,800 | $63,600 |
Source: Public Records
Map
Nearby Homes