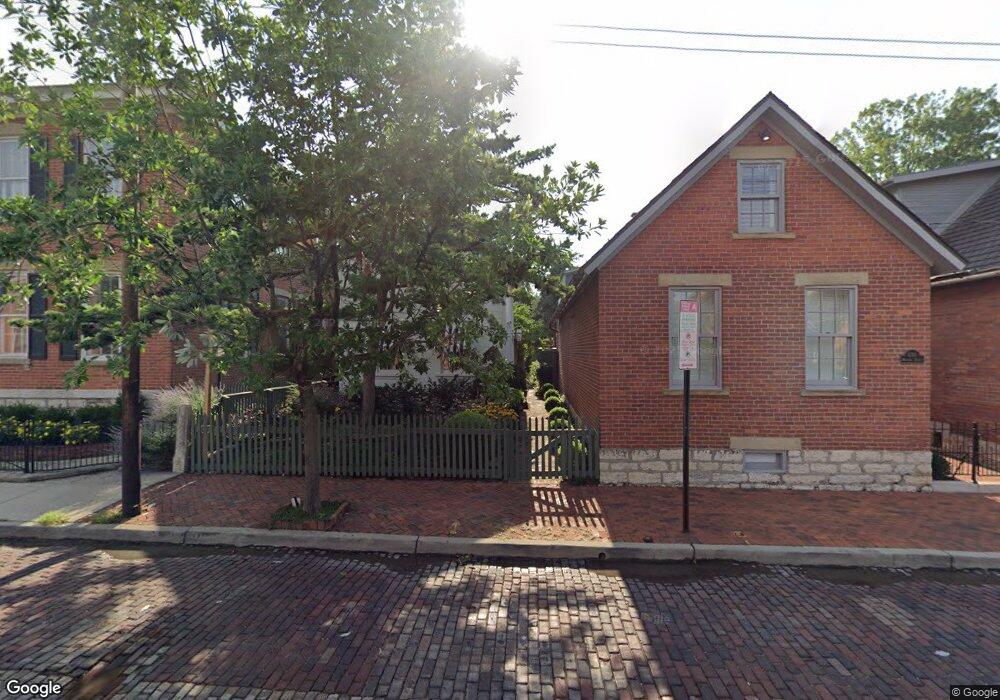
628 Mohawk St Columbus, OH 43206
German Village NeighborhoodEstimated Value: $428,455 - $552,000
2
Beds
1
Bath
1,106
Sq Ft
$442/Sq Ft
Est. Value
About This Home
This home is located at 628 Mohawk St, Columbus, OH 43206 and is currently estimated at $488,864, approximately $442 per square foot. 628 Mohawk St is a home located in Franklin County with nearby schools including Siebert Elementary School, South High School, and South Columbus Preparatory Academy.
Ownership History
Date
Name
Owned For
Owner Type
Purchase Details
Closed on
Apr 15, 2005
Sold by
Alibrando Sandra M and Thompson Richard
Bought by
Thiell Edward P
Current Estimated Value
Purchase Details
Closed on
Jan 27, 1986
Bought by
Centofanti Sandra M
Create a Home Valuation Report for This Property
The Home Valuation Report is an in-depth analysis detailing your home's value as well as a comparison with similar homes in the area
Home Values in the Area
Average Home Value in this Area
Purchase History
| Date | Buyer | Sale Price | Title Company |
|---|---|---|---|
| Thiell Edward P | $210,000 | Chicago Tit | |
| Centofanti Sandra M | $62,000 | -- |
Source: Public Records
Tax History
| Year | Tax Paid | Tax Assessment Tax Assessment Total Assessment is a certain percentage of the fair market value that is determined by local assessors to be the total taxable value of land and additions on the property. | Land | Improvement |
|---|---|---|---|---|
| 2025 | $6,144 | $136,890 | $90,160 | $46,730 |
| 2024 | $6,144 | $136,890 | $90,160 | $46,730 |
| 2023 | $6,065 | $136,885 | $90,160 | $46,725 |
| 2022 | $4,791 | $92,370 | $37,870 | $54,500 |
| 2021 | $4,799 | $92,370 | $37,870 | $54,500 |
| 2020 | $4,805 | $92,370 | $37,870 | $54,500 |
| 2019 | $4,852 | $79,980 | $32,940 | $47,040 |
| 2018 | $4,677 | $79,980 | $32,940 | $47,040 |
| 2017 | $4,910 | $79,980 | $32,940 | $47,040 |
| 2016 | $4,971 | $75,040 | $27,090 | $47,950 |
| 2015 | $4,512 | $75,040 | $27,090 | $47,950 |
| 2014 | $4,523 | $75,040 | $27,090 | $47,950 |
| 2013 | $2,125 | $71,470 | $25,795 | $45,675 |
Source: Public Records
Map
Nearby Homes
- 186 E Sycamore St
- 242 E Sycamore St
- 169 E Livingston Ave
- 279-281 E Beck St
- 626 Jaeger St Unit 7
- 496 S 3rd St
- 722 Mohawk St Unit 722
- 308 Jackson St
- 639 S Grant Ave
- 582 S Pearl St Unit 582
- 717 S 3rd St
- 616 S Grant Ave Unit 3B
- 707 Sycamore Place Unit 707
- 46 E Frankfort St
- 33 E Frankfort St
- 385-387 Jackson St
- 570 S Front St Unit 312
- 570 S Front St Unit 104
- 320 E Columbus St
- 424 Jackson St
Your Personal Tour Guide
Ask me questions while you tour the home.