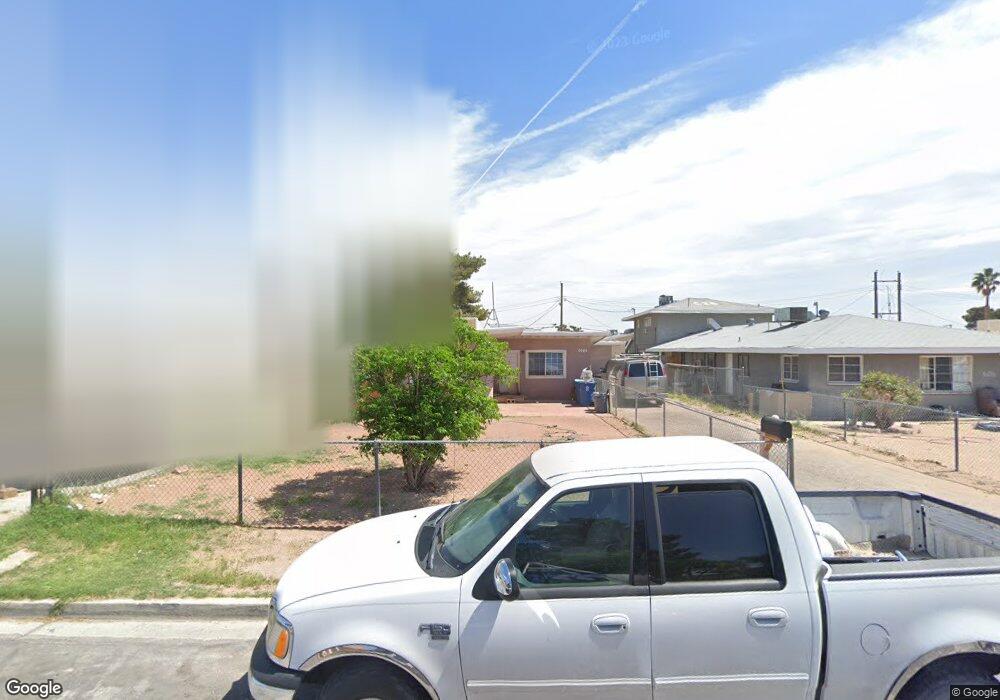
628 N 10th St Las Vegas, NV 89101
Downtown Las Vegas NeighborhoodEstimated Value: $270,000 - $288,000
2
Beds
1
Bath
1,074
Sq Ft
$259/Sq Ft
Est. Value
About This Home
This home is located at 628 N 10th St, Las Vegas, NV 89101 and is currently estimated at $278,010, approximately $258 per square foot. 628 N 10th St is a home located in Clark County with nearby schools including C.P. Squires Elementary School, J.D. Smith Middle School, and Rancho High School.
Ownership History
Date
Name
Owned For
Owner Type
Purchase Details
Closed on
Apr 25, 2017
Sold by
Bierfass Ricardo A
Bought by
Agcom I L L C
Current Estimated Value
Purchase Details
Closed on
Jun 16, 2016
Sold by
Fitzpatrick Laura B
Bought by
Bierfass R A Revocable Living Trust
Purchase Details
Closed on
Jun 12, 2014
Sold by
Bierfass Ricardo A
Bought by
Ra Bierfass Revocable Living Trust
Purchase Details
Closed on
Jun 4, 2014
Sold by
Leyva Rafael
Bought by
Bierfass Ricardo A
Purchase Details
Closed on
Aug 20, 2007
Sold by
Leavitt Leonard
Bought by
Leyva Rafael
Purchase Details
Closed on
Jan 23, 2004
Sold by
Leavitt Leonard
Bought by
Leyva Rafael
Home Financials for this Owner
Home Financials are based on the most recent Mortgage that was taken out on this home.
Original Mortgage
$84,247
Interest Rate
5.8%
Mortgage Type
FHA
Create a Home Valuation Report for This Property
The Home Valuation Report is an in-depth analysis detailing your home's value as well as a comparison with similar homes in the area
Home Values in the Area
Average Home Value in this Area
Purchase History
| Date | Buyer | Sale Price | Title Company |
|---|---|---|---|
| Agcom I L L C | -- | None Available | |
| Bierfass R A Revocable Living Trust | $1,528 | None Available | |
| Ra Bierfass Revocable Living Trust | -- | -- | |
| Bierfass Ricardo A | $39,600 | None Available | |
| Leyva Rafael | -- | Chicago Title | |
| Leyva Rafael | $85,000 | United Title Of Nevada |
Source: Public Records
Mortgage History
| Date | Status | Borrower | Loan Amount |
|---|---|---|---|
| Previous Owner | Leyva Rafael | $84,247 |
Source: Public Records
Tax History Compared to Growth
Tax History
| Year | Tax Paid | Tax Assessment Tax Assessment Total Assessment is a certain percentage of the fair market value that is determined by local assessors to be the total taxable value of land and additions on the property. | Land | Improvement |
|---|---|---|---|---|
| 2025 | $607 | $36,770 | $24,500 | $12,270 |
| 2024 | $563 | $36,770 | $24,500 | $12,270 |
| 2023 | $563 | $35,603 | $24,500 | $11,103 |
| 2022 | $521 | $27,409 | $17,500 | $9,909 |
| 2021 | $483 | $24,972 | $15,750 | $9,222 |
| 2020 | $445 | $22,276 | $13,300 | $8,976 |
| 2019 | $417 | $21,937 | $13,300 | $8,637 |
| 2018 | $398 | $18,574 | $10,500 | $8,074 |
| 2017 | $549 | $16,748 | $8,750 | $7,998 |
| 2016 | $939 | $12,742 | $6,300 | $6,442 |
| 2015 | $660 | $12,769 | $5,250 | $7,519 |
| 2014 | $360 | $10,670 | $3,500 | $7,170 |
Source: Public Records
Map
Nearby Homes
- 626 N 10th St
- 636 N 10th St
- 620 N 10th St
- 629 N 11th St Unit 4
- 629 N 11th St Unit 2
- 629 N 11th St Unit 2 B
- 633 N 11th St
- 625 N 11th St Unit B-D
- 625 N 11th St Unit B
- 625 N 11th St Unit A-D
- 625 N 11th St Unit C
- 625 N 11th St
- 637 N 11th St Unit 4
- 637 N 11th St Unit B
- 637 N 11th St Unit C
- 637 N 11th St Unit A
- 637 N 11th St Unit D
- 621 N 11th St Unit 4
- 621 N 11th St Unit 1
- 621 N 11th St Unit 3