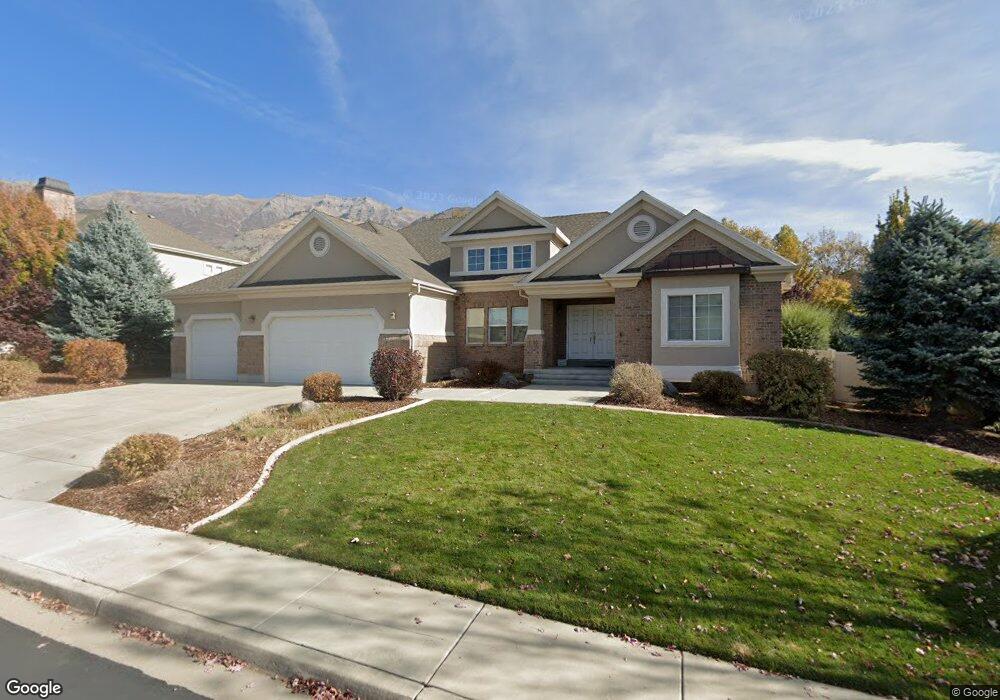
628 N 120 E Lindon, UT 84042
Estimated Value: $1,100,000 - $1,314,512
7
Beds
5
Baths
5,227
Sq Ft
$233/Sq Ft
Est. Value
About This Home
This home is located at 628 N 120 E, Lindon, UT 84042 and is currently estimated at $1,216,878, approximately $232 per square foot. 628 N 120 E is a home located in Utah County with nearby schools including Lindon Elementary School, Oak Canyon Junior High School, and Pleasant Grove High School.
Ownership History
Date
Name
Owned For
Owner Type
Purchase Details
Closed on
Feb 10, 2020
Sold by
Walch Victor L and Walch Carole F
Bought by
Walch Victor L and Walch Victor L
Current Estimated Value
Purchase Details
Closed on
Apr 1, 2013
Sold by
Walch Victor and Walch Carole
Bought by
Walch Victor L
Purchase Details
Closed on
Jul 7, 2011
Sold by
Ivory Homes Ltd
Bought by
Walch Victor and Walch Carole
Create a Home Valuation Report for This Property
The Home Valuation Report is an in-depth analysis detailing your home's value as well as a comparison with similar homes in the area
Home Values in the Area
Average Home Value in this Area
Purchase History
| Date | Buyer | Sale Price | Title Company |
|---|---|---|---|
| Walch Victor L | -- | None Available | |
| Walch Victor L | -- | None Available | |
| Walch Victor L | -- | None Available | |
| Walch Victor | -- | Cottonwood Title Insurance A | |
| Ivory Homes Ltd | -- | Cottonwood Title Insurance A |
Source: Public Records
Tax History
| Year | Tax Paid | Tax Assessment Tax Assessment Total Assessment is a certain percentage of the fair market value that is determined by local assessors to be the total taxable value of land and additions on the property. | Land | Improvement |
|---|---|---|---|---|
| 2025 | $4,963 | $602,580 | -- | -- |
| 2024 | $4,963 | $611,765 | $0 | $0 |
| 2023 | $4,834 | $640,035 | $0 | $0 |
| 2022 | $4,828 | $617,485 | $0 | $0 |
| 2021 | $4,322 | $833,600 | $278,100 | $555,500 |
| 2020 | $4,144 | $786,900 | $252,800 | $534,100 |
| 2019 | $3,738 | $740,500 | $206,400 | $534,100 |
| 2018 | $3,817 | $712,900 | $181,100 | $531,800 |
| 2017 | $3,870 | $387,475 | $0 | $0 |
| 2016 | $3,994 | $369,875 | $0 | $0 |
| 2015 | $4,174 | $365,475 | $0 | $0 |
| 2014 | $3,626 | $314,545 | $0 | $0 |
Source: Public Records
Map
Nearby Homes
- 308 E 750 N
- 314 E 750 N
- 517 N 80 W
- 1172 E Murdock Dr
- 433 N Locust Ave
- 1176 E 470 S
- 650 S 1600 E
- 271 N 400 E Unit 1
- 1541 E Blackhawk Dr
- 341 W 600 N
- 789 E 820 S
- 355 W 600 N
- 1017 E 450 S
- 325 S 1300 E
- 190 E 800 N Unit 4
- 150 E 800 N Unit 2
- 170 E 800 N Unit 3
- 130 E 800 N Unit 1
- 1677 E 480 S
- 793 E Orchard Dr
Your Personal Tour Guide
Ask me questions while you tour the home.