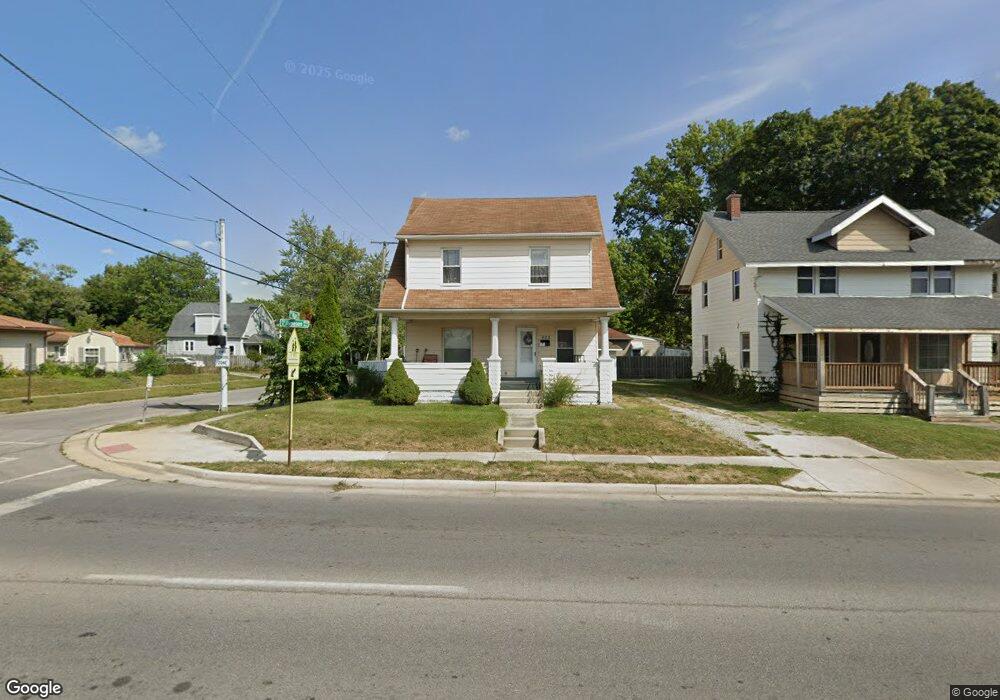
628 N Jameson Ave Lima, OH 45805
Central Lima NeighborhoodEstimated Value: $66,000 - $88,000
3
Beds
1
Bath
1,456
Sq Ft
$54/Sq Ft
Est. Value
About This Home
This home is located at 628 N Jameson Ave, Lima, OH 45805 and is currently estimated at $79,333, approximately $54 per square foot. 628 N Jameson Ave is a home located in Allen County with nearby schools including Heritage Elementary School, Lima West Middle School, and Lima North Middle School.
Ownership History
Date
Name
Owned For
Owner Type
Purchase Details
Closed on
Sep 19, 2008
Sold by
Vision 3 Investments Llc
Bought by
Vision 2 Investments Llc
Current Estimated Value
Purchase Details
Closed on
Aug 18, 2008
Sold by
Deutsche Bank National Trust Co
Bought by
Vision 3 Investments Llc
Purchase Details
Closed on
May 7, 2008
Sold by
Carter Bobbie
Bought by
Deutsche Bank National Trust Co and Gsamp Trust 2006-He1
Purchase Details
Closed on
Jun 3, 1999
Sold by
Pratt Terry E
Bought by
Cowan Shanita L
Home Financials for this Owner
Home Financials are based on the most recent Mortgage that was taken out on this home.
Original Mortgage
$10,600
Interest Rate
6.94%
Mortgage Type
New Conventional
Purchase Details
Closed on
Sep 20, 1991
Bought by
Pratt Terry E
Create a Home Valuation Report for This Property
The Home Valuation Report is an in-depth analysis detailing your home's value as well as a comparison with similar homes in the area
Home Values in the Area
Average Home Value in this Area
Purchase History
| Date | Buyer | Sale Price | Title Company |
|---|---|---|---|
| Vision 2 Investments Llc | -- | Attorney | |
| Vision 3 Investments Llc | $19,900 | Resource Title Agency Inc | |
| Deutsche Bank National Trust Co | $36,000 | None Available | |
| Cowan Shanita L | $42,000 | -- | |
| Pratt Terry E | $27,900 | -- |
Source: Public Records
Mortgage History
| Date | Status | Borrower | Loan Amount |
|---|---|---|---|
| Previous Owner | Cowan Shanita L | $10,600 |
Source: Public Records
Tax History
| Year | Tax Paid | Tax Assessment Tax Assessment Total Assessment is a certain percentage of the fair market value that is determined by local assessors to be the total taxable value of land and additions on the property. | Land | Improvement |
|---|---|---|---|---|
| 2024 | $799 | $20,930 | $2,310 | $18,620 |
| 2023 | $802 | $18,380 | $2,030 | $16,350 |
| 2022 | $806 | $18,380 | $2,030 | $16,350 |
| 2021 | $854 | $18,380 | $2,030 | $16,350 |
| 2020 | $813 | $15,440 | $1,960 | $13,480 |
| 2019 | $813 | $15,440 | $1,960 | $13,480 |
| 2018 | $804 | $15,440 | $1,960 | $13,480 |
| 2017 | $815 | $15,440 | $1,960 | $13,480 |
| 2016 | $827 | $15,440 | $1,960 | $13,480 |
| 2015 | $879 | $15,440 | $1,960 | $13,480 |
| 2014 | $879 | $16,250 | $2,070 | $14,180 |
| 2013 | $857 | $16,250 | $2,070 | $14,180 |
Source: Public Records
Map
Nearby Homes
- 949 Leland Ave
- 1120 Richie Ave
- 974 Richie Ave
- 513 N Charles St
- 503 N Charles St
- 1160 Richie Ave
- 1027 Brice Ave
- 824 Rice Ave
- 618 Woodward Ave
- 1023 Brice Ave
- 703 N Collett St
- 1209 Rice Ave
- 615 N Collett St
- 0 Latham
- 508 N Collett St
- 631 Hazel Ave
- 1015 N Cole St
- 1245 Latham Ave
- 841 N Baxter St
- 816 N Baxter St
- 624 N Jameson Ave
- 1027 Rice Ave
- 708 N Jameson Ave
- 1021 Rice Ave
- 1021 Rice Ave
- 615,617 N Jameson Ave
- 627 N Jameson Ave
- 617 N Jameson Ave
- 615 N Jameson Ave
- 712 N Jameson Ave
- 1020 Rice Ave
- 606 N Jameson Ave
- 1030 Richie Ave
- 1015 Rice Ave
- 1026 Richie Ave
- 1018 Rice Ave
- 609 N Jameson Ave
- 1020 Richie Ave
- 1115 Rice Ave
- 1014 Rice Ave
Your Personal Tour Guide
Ask me questions while you tour the home.