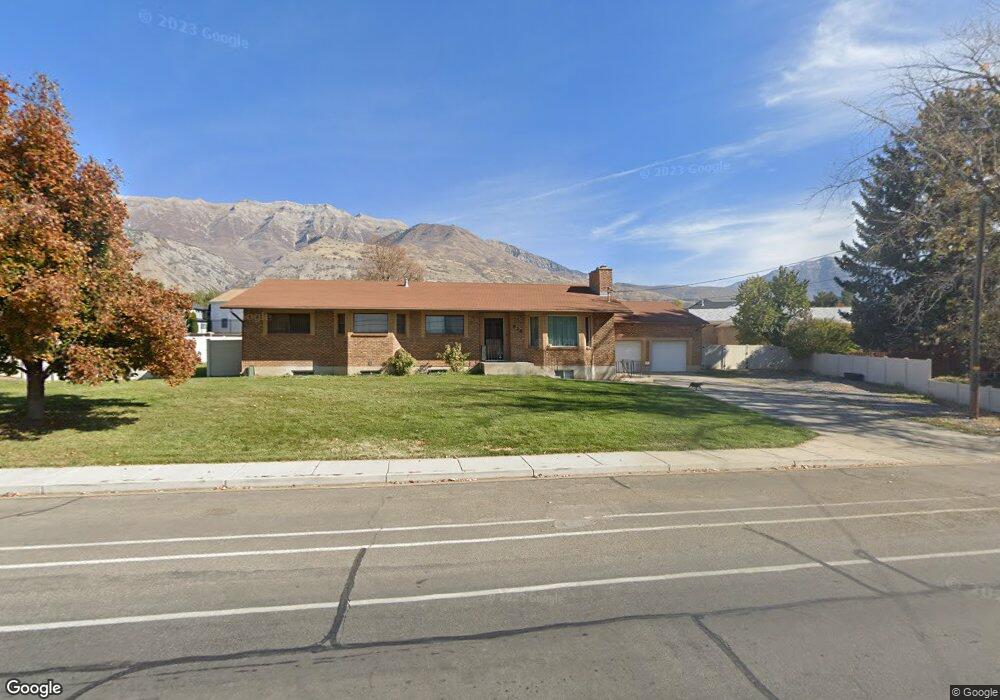
628 N Locust Ave Lindon, UT 84042
Estimated Value: $627,000 - $865,471
2
Beds
3
Baths
1,866
Sq Ft
$418/Sq Ft
Est. Value
About This Home
This home is located at 628 N Locust Ave, Lindon, UT 84042 and is currently estimated at $780,118, approximately $418 per square foot. 628 N Locust Ave is a home with nearby schools including Lindon Elementary School, Oak Canyon Junior High School, and Pleasant Grove High School.
Ownership History
Date
Name
Owned For
Owner Type
Purchase Details
Closed on
Oct 9, 2010
Sold by
Tomlinson Shirl L and Fryer Huggard 1999 Fam Afton B
Bought by
Clark Kelly S and Clark Tracy L
Current Estimated Value
Home Financials for this Owner
Home Financials are based on the most recent Mortgage that was taken out on this home.
Original Mortgage
$222,010
Outstanding Balance
$145,980
Interest Rate
4.28%
Mortgage Type
FHA
Estimated Equity
$634,138
Purchase Details
Closed on
Mar 24, 2010
Sold by
Huggard Development Llc
Bought by
Tomlinson Shirl L and Afton B Fryer Huggard 1999 Family Living
Purchase Details
Closed on
Apr 21, 1999
Sold by
Fryer Afton B
Bought by
Huggard Afton B Fryer and Tomlinson Shirl L
Create a Home Valuation Report for This Property
The Home Valuation Report is an in-depth analysis detailing your home's value as well as a comparison with similar homes in the area
Home Values in the Area
Average Home Value in this Area
Purchase History
| Date | Buyer | Sale Price | Title Company |
|---|---|---|---|
| Clark Kelly S | -- | Bartlett Title Insurance Ag | |
| Tomlinson Shirl L | -- | Bartlett Title Insurance Ag | |
| Huggard Afton B Fryer | -- | -- |
Source: Public Records
Mortgage History
| Date | Status | Borrower | Loan Amount |
|---|---|---|---|
| Open | Clark Kelly S | $222,010 |
Source: Public Records
Tax History Compared to Growth
Tax History
| Year | Tax Paid | Tax Assessment Tax Assessment Total Assessment is a certain percentage of the fair market value that is determined by local assessors to be the total taxable value of land and additions on the property. | Land | Improvement |
|---|---|---|---|---|
| 2025 | $3,218 | $442,970 | $452,200 | $353,200 |
| 2024 | $3,218 | $396,660 | $0 | $0 |
| 2023 | $2,978 | $394,295 | $0 | $0 |
| 2022 | $3,043 | $389,180 | $0 | $0 |
| 2021 | $2,544 | $490,600 | $287,000 | $203,600 |
| 2020 | $2,405 | $456,700 | $260,900 | $195,800 |
| 2019 | $2,064 | $408,800 | $213,000 | $195,800 |
| 2018 | $2,050 | $382,800 | $187,000 | $195,800 |
| 2017 | $1,915 | $191,730 | $0 | $0 |
| 2016 | $1,749 | $162,030 | $0 | $0 |
| 2015 | $1,677 | $146,795 | $0 | $0 |
| 2014 | $1,427 | $139,425 | $0 | $0 |
Source: Public Records
Map
Nearby Homes