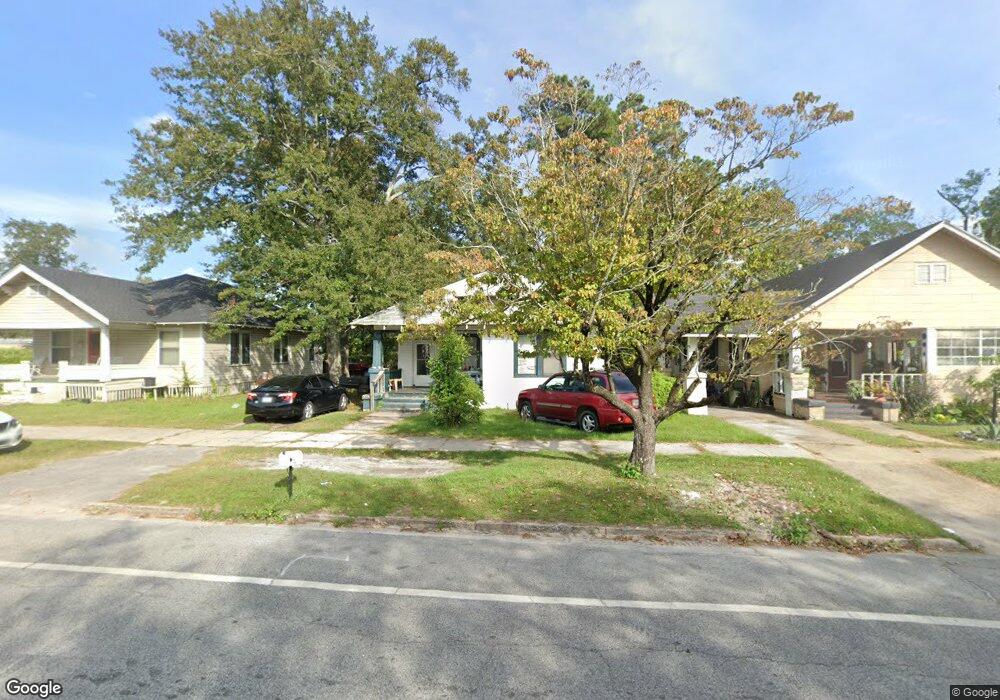
628 N Nicholls St Waycross, GA 31503
Estimated Value: $69,000 - $113,000
2
Beds
1
Bath
1,044
Sq Ft
$80/Sq Ft
Est. Value
About This Home
This home is located at 628 N Nicholls St, Waycross, GA 31503 and is currently estimated at $83,321, approximately $79 per square foot. 628 N Nicholls St is a home located in Ware County with nearby schools including Waresboro Elementary School, Ware County Middle School, and Ware County High School.
Ownership History
Date
Name
Owned For
Owner Type
Purchase Details
Closed on
Jan 21, 2005
Sold by
Elliott Valada D
Bought by
Elliott Vincent T and Daphne Elliott V
Current Estimated Value
Home Financials for this Owner
Home Financials are based on the most recent Mortgage that was taken out on this home.
Original Mortgage
$30,000
Interest Rate
5.66%
Mortgage Type
New Conventional
Purchase Details
Closed on
Nov 23, 2004
Sold by
Strickland Charlene
Bought by
Elliott Vincent and Elliott Daphne
Home Financials for this Owner
Home Financials are based on the most recent Mortgage that was taken out on this home.
Original Mortgage
$30,000
Interest Rate
5.66%
Mortgage Type
New Conventional
Purchase Details
Closed on
Aug 24, 2004
Sold by
Petty Willie M
Bought by
Strickland Charlene
Purchase Details
Closed on
Aug 16, 2004
Sold by
Petty Daniel
Bought by
Petty Willie M
Purchase Details
Closed on
May 16, 2003
Sold by
Petty A C
Bought by
Strickland Charlene Petty
Create a Home Valuation Report for This Property
The Home Valuation Report is an in-depth analysis detailing your home's value as well as a comparison with similar homes in the area
Home Values in the Area
Average Home Value in this Area
Purchase History
| Date | Buyer | Sale Price | Title Company |
|---|---|---|---|
| Elliott Vincent T | -- | -- | |
| Elliott Vincent | $12,000 | -- | |
| Strickland Charlene | -- | -- | |
| Petty Willie M | -- | -- | |
| Strickland Charlene Petty | -- | -- |
Source: Public Records
Mortgage History
| Date | Status | Borrower | Loan Amount |
|---|---|---|---|
| Closed | Elliott Vincent T | $30,000 |
Source: Public Records
Tax History Compared to Growth
Tax History
| Year | Tax Paid | Tax Assessment Tax Assessment Total Assessment is a certain percentage of the fair market value that is determined by local assessors to be the total taxable value of land and additions on the property. | Land | Improvement |
|---|---|---|---|---|
| 2024 | $601 | $17,031 | $840 | $16,191 |
| 2023 | $587 | $10,483 | $688 | $9,795 |
| 2022 | $418 | $10,483 | $688 | $9,795 |
| 2021 | $335 | $7,748 | $688 | $7,060 |
| 2020 | $332 | $7,622 | $688 | $6,934 |
| 2019 | $323 | $7,307 | $688 | $6,619 |
| 2018 | $312 | $6,992 | $688 | $6,304 |
| 2017 | $305 | $6,992 | $688 | $6,304 |
| 2016 | $305 | $6,992 | $688 | $6,304 |
| 2015 | $307 | $6,992 | $688 | $6,304 |
| 2014 | $307 | $6,992 | $688 | $6,304 |
| 2013 | -- | $6,992 | $688 | $6,304 |
Source: Public Records
Map
Nearby Homes
- 1006 Roosevelt St
- 601 N Nicholls St
- 1003 Carswell Ave
- 629 Remshart St
- 605 Walker St
- 505 N Nicholls St
- 503 N Nicholls St
- 506 McDonald St
- 516 Folks St
- 00 Roosevelt St
- 1027 Robert St
- 812 Effie St
- 803 Elizabeth St
- 1401 Carswell Ave
- 1208 Margaret St
- 1103 Ann St
- 0 Camp Branch Cross Rd Unit 12958956
- 0 Camp Branch Cross Rd Unit 147575
- 0 Camp Branch Cross Rd Unit 10127958
- 1322 Jane St