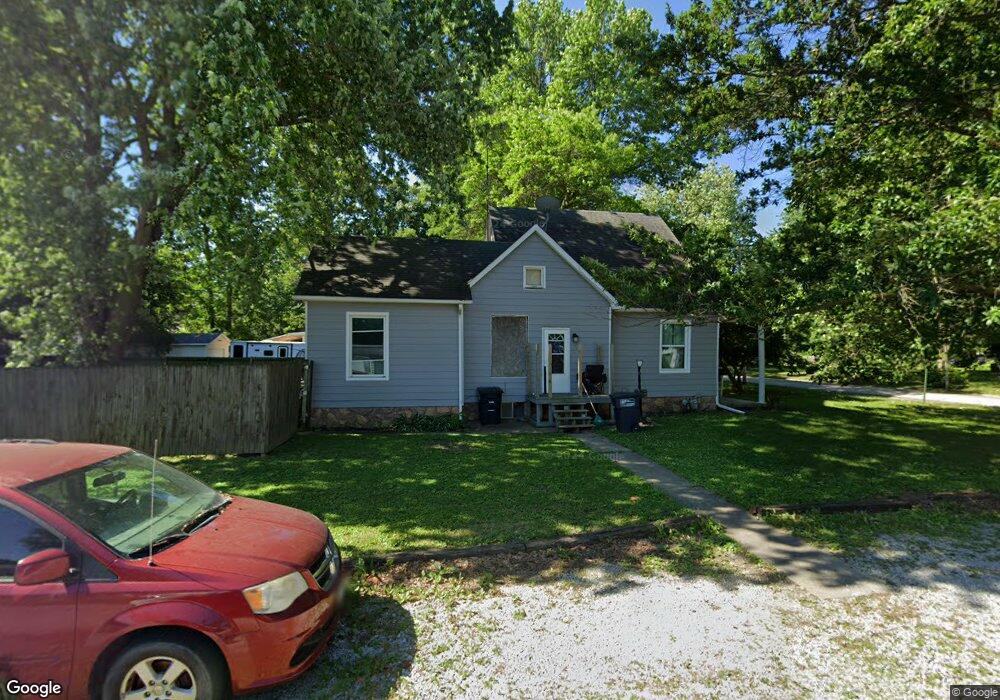
628 N Walnut St Litchfield, IL 62056
Estimated Value: $67,439 - $141,000
--
Bed
--
Bath
--
Sq Ft
0.33
Acres
About This Home
This home is located at 628 N Walnut St, Litchfield, IL 62056 and is currently estimated at $98,110. 628 N Walnut St is a home located in Montgomery County with nearby schools including Madison Park Elementary School, J.D. Colt Elementary School, and Litchfield Elementary School.
Ownership History
Date
Name
Owned For
Owner Type
Purchase Details
Closed on
Jan 6, 2012
Sold by
Pieper Matthew John
Bought by
Buzick Tyffani L
Current Estimated Value
Home Financials for this Owner
Home Financials are based on the most recent Mortgage that was taken out on this home.
Original Mortgage
$38,250
Outstanding Balance
$15,521
Interest Rate
3.98%
Mortgage Type
Purchase Money Mortgage
Estimated Equity
$82,589
Purchase Details
Closed on
Oct 22, 2010
Sold by
Murphy Julie A
Bought by
Pieper Matthew J
Purchase Details
Closed on
Oct 12, 2010
Sold by
Markulakis Jenifer Leigh and Pieper Matthew Jon
Bought by
Harshman Phyllis M
Purchase Details
Closed on
Oct 2, 2010
Sold by
Markulakis Jenifer L
Bought by
Pieper Matthew J
Purchase Details
Closed on
Sep 10, 2010
Sold by
Pease Jane E
Bought by
Markulakis Jenifer Leigh and Pieper Matthew John
Create a Home Valuation Report for This Property
The Home Valuation Report is an in-depth analysis detailing your home's value as well as a comparison with similar homes in the area
Home Values in the Area
Average Home Value in this Area
Purchase History
| Date | Buyer | Sale Price | Title Company |
|---|---|---|---|
| Buzick Tyffani L | $39,000 | None Available | |
| Pieper Matthew J | -- | None Available | |
| Harshman Phyllis M | -- | None Available | |
| Pieper Matthew J | -- | None Available | |
| Markulakis Jenifer Leigh | -- | None Available |
Source: Public Records
Mortgage History
| Date | Status | Borrower | Loan Amount |
|---|---|---|---|
| Open | Buzick Tyffani L | $38,250 |
Source: Public Records
Tax History Compared to Growth
Tax History
| Year | Tax Paid | Tax Assessment Tax Assessment Total Assessment is a certain percentage of the fair market value that is determined by local assessors to be the total taxable value of land and additions on the property. | Land | Improvement |
|---|---|---|---|---|
| 2024 | $1,024 | $18,160 | $7,570 | $10,590 |
| 2023 | $956 | $17,150 | $7,150 | $10,000 |
| 2022 | $893 | $16,190 | $6,750 | $9,440 |
| 2021 | $854 | $15,670 | $6,530 | $9,140 |
| 2020 | $782 | $14,850 | $6,190 | $8,660 |
| 2019 | $785 | $14,580 | $6,080 | $8,500 |
| 2018 | $769 | $14,140 | $5,900 | $8,240 |
| 2017 | $751 | $13,950 | $5,820 | $8,130 |
| 2016 | $729 | $13,540 | $5,650 | $7,890 |
| 2015 | $700 | $13,630 | $5,690 | $7,940 |
| 2013 | $674 | $13,410 | $5,600 | $7,810 |
Source: Public Records
Map
Nearby Homes
- 604 N Illinois Ave
- 822 E Union Ave
- 620 N Chestnut St
- 419 E Corwin St
- 413 E Beach St
- 707 E Clark St
- TBD N Van Buren St
- 34 Woodlawn Dr
- 227 S Montgomery Ave
- 305 E Hauser St
- 35 Northcrest Dr
- 211 E Beach St
- 704 N Monroe St
- 821 N State St
- 1500 N Van Buren St
- 1600 N Harrison St
- 123 W Ferdon St
- 821 N Madison St
- TBD N Madison St
- 1521 N Jackson St
- 616 N Walnut St
- 704 N Walnut St
- 821 E Henrichs St
- 625 N Walnut St
- 629 N Illinois Ave
- 710 N Walnut St
- 625 N Illinois Ave
- 703 N Illinois Ave
- 617 N Walnut St
- 705 N Illinois Ave
- 605 N Walnut St
- 603 N Walnut St
- 718 N Walnut St
- 717 N Walnut St
- 819 E Henrichs St
- 721 N Illinois Ave
- 909 E Union Ave
- 721 N Walnut St
- 722 N Walnut St
- 618 N Montgomery Ave