628 Newport Ave Attleboro, MA 02703
Estimated Value: $419,000 - $440,000
3
Beds
1
Bath
1,211
Sq Ft
$354/Sq Ft
Est. Value
About This Home
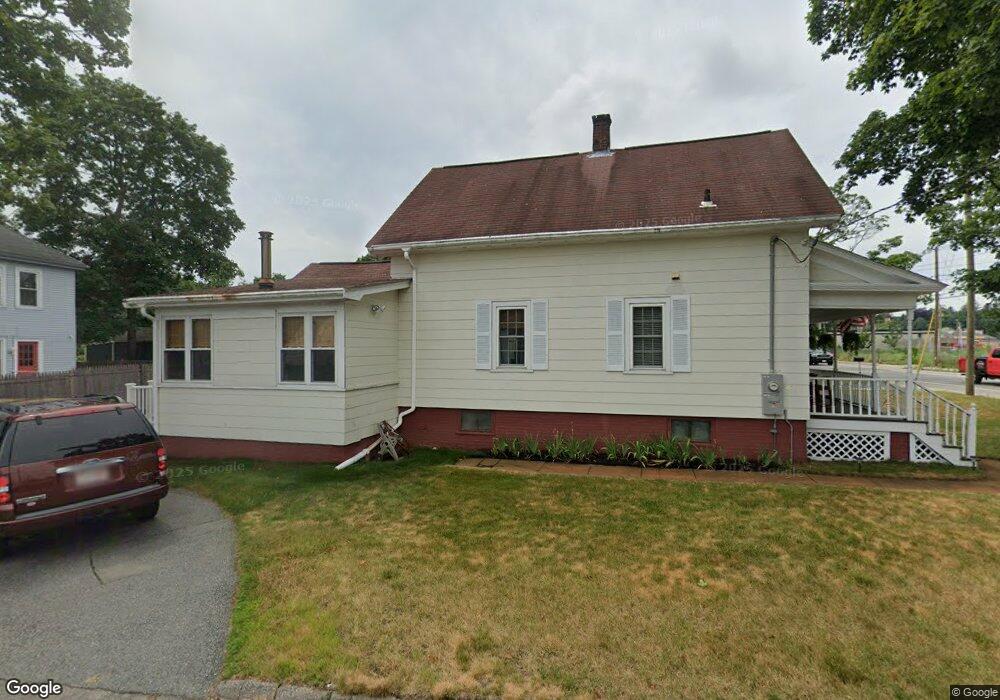
This home is located at 628 Newport Ave, Attleboro, MA 02703 and is currently estimated at $429,160, approximately $354 per square foot. 628 Newport Ave is a home located in Bristol County with nearby schools including Hill-Roberts Elementary School, Robert J. Coelho Middle School, and Attleboro High School.
Ownership History
Date
Name
Owned For
Owner Type
Purchase Details
Closed on
Oct 29, 1993
Sold by
Flanagan Mark E and Flanagan Christine R
Bought by
Prout Ronald G and Prout Diane E
Current Estimated Value
Home Financials for this Owner
Home Financials are based on the most recent Mortgage that was taken out on this home.
Original Mortgage
$89,043
Interest Rate
6.86%
Mortgage Type
Purchase Money Mortgage
Create a Home Valuation Report for This Property
The Home Valuation Report is an in-depth analysis detailing your home's value as well as a comparison with similar homes in the area
Home Values in the Area
Average Home Value in this Area
Purchase History
| Date | Buyer | Sale Price | Title Company |
|---|---|---|---|
| Prout Ronald G | $91,000 | -- |
Source: Public Records
Mortgage History
| Date | Status | Borrower | Loan Amount |
|---|---|---|---|
| Open | Prout Ronald G | $115,000 | |
| Closed | Prout Ronald G | $89,043 | |
| Previous Owner | Prout Ronald G | $12,000 |
Source: Public Records
Tax History Compared to Growth
Tax History
| Year | Tax Paid | Tax Assessment Tax Assessment Total Assessment is a certain percentage of the fair market value that is determined by local assessors to be the total taxable value of land and additions on the property. | Land | Improvement |
|---|---|---|---|---|
| 2025 | $4,066 | $324,000 | $113,300 | $210,700 |
| 2024 | $4,067 | $319,500 | $113,300 | $206,200 |
| 2023 | $3,888 | $284,000 | $103,000 | $181,000 |
| 2022 | $3,745 | $259,200 | $98,100 | $161,100 |
| 2021 | $4,189 | $230,500 | $94,300 | $136,200 |
| 2020 | $3,349 | $230,000 | $91,600 | $138,400 |
| 2019 | $3,108 | $219,500 | $89,800 | $129,700 |
| 2018 | $4,650 | $196,700 | $87,200 | $109,500 |
| 2017 | $2,885 | $198,300 | $87,200 | $111,100 |
| 2016 | $2,608 | $176,000 | $81,500 | $94,500 |
| 2015 | $2,355 | $160,100 | $81,500 | $78,600 |
| 2014 | $2,279 | $153,500 | $77,300 | $76,200 |
Source: Public Records
Map
Nearby Homes
- 11 Howarth Ave
- 543 Newport Ave
- 64 Highland Ave Unit B
- 64 Highland Ave Unit A
- 48 May St
- 23 Cumberland Ave
- 17 Lockwood Ave
- 59 Samuel Way
- 130 Zoar Ave
- 135 Cumberland Ave
- 39 Slade Ave
- 338 Newport Ave
- 0 Middle St
- 44 Buffington St
- 276 Newport Ave
- 15 Arline Dr
- 31 Carleton St
- 176 Read St
- 0 Mendon Rd
- 96 Robinson Ave
- 9 Roy Ave
- 636 Newport Ave
- 638 Newport Ave
- 618 Newport Ave
- 12 Roy Ave
- 646 Newport Ave
- 22 Roy Ave
- 17 Roy Ave
- 610 Newport Ave
- 652 Newport Ave
- 652 Newport Ave Unit NEWPORT AVE
- 9 Fairfield Ave
- 607 Newport Ave
- 609 Newport Ave
- 9 Angeline St
- 21 Roy Ave
- 1A Highland Ave
- 1 Highland Ave
- 1 Highland Ave
- 4 Fairfield Ave