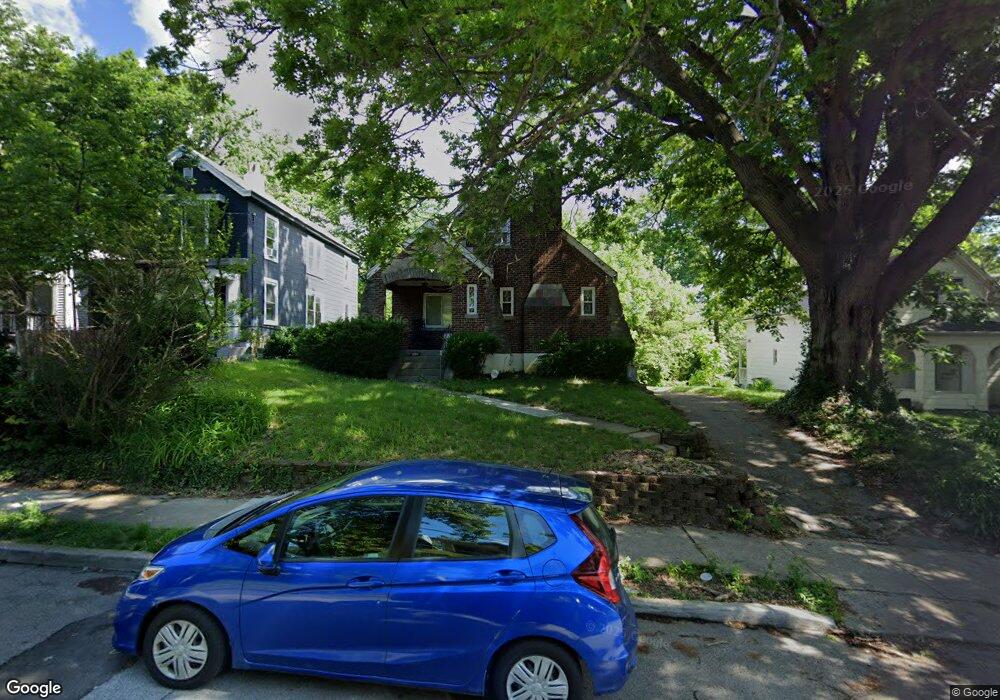
628 Probasco St Cincinnati, OH 45220
Clifton NeighborhoodEstimated Value: $245,000 - $270,000
2
Beds
1
Bath
1,597
Sq Ft
$160/Sq Ft
Est. Value
About This Home
This home is located at 628 Probasco St, Cincinnati, OH 45220 and is currently estimated at $255,297, approximately $159 per square foot. 628 Probasco St is a home located in Hamilton County with nearby schools including Clifton Area Neighborhood School, Robert A. Taft Information Technology High School, and Gilbert A. Dater High School.
Ownership History
Date
Name
Owned For
Owner Type
Purchase Details
Closed on
Apr 7, 2006
Sold by
Delfavero Brandy R Brough and Delfavero Michael A
Bought by
Oren Liran and Oren Jessica
Current Estimated Value
Home Financials for this Owner
Home Financials are based on the most recent Mortgage that was taken out on this home.
Original Mortgage
$111,600
Interest Rate
6.66%
Mortgage Type
Unknown
Purchase Details
Closed on
Feb 25, 2004
Sold by
Jpl Properties
Bought by
Brough Brandy R
Home Financials for this Owner
Home Financials are based on the most recent Mortgage that was taken out on this home.
Original Mortgage
$110,000
Interest Rate
5.71%
Mortgage Type
Unknown
Purchase Details
Closed on
Aug 7, 2003
Sold by
White Jimmie Lee and White Lillie Ann
Bought by
Jpl Properties
Home Financials for this Owner
Home Financials are based on the most recent Mortgage that was taken out on this home.
Original Mortgage
$92,000
Interest Rate
5.47%
Mortgage Type
Unknown
Create a Home Valuation Report for This Property
The Home Valuation Report is an in-depth analysis detailing your home's value as well as a comparison with similar homes in the area
Home Values in the Area
Average Home Value in this Area
Purchase History
| Date | Buyer | Sale Price | Title Company |
|---|---|---|---|
| Oren Liran | -- | None Available | |
| Brough Brandy R | $137,500 | -- | |
| Jpl Properties | $92,000 | -- |
Source: Public Records
Mortgage History
| Date | Status | Borrower | Loan Amount |
|---|---|---|---|
| Previous Owner | Oren Liran | $111,600 | |
| Previous Owner | Brough Brandy R | $110,000 | |
| Previous Owner | Jpl Properties | $92,000 |
Source: Public Records
Tax History
| Year | Tax Paid | Tax Assessment Tax Assessment Total Assessment is a certain percentage of the fair market value that is determined by local assessors to be the total taxable value of land and additions on the property. | Land | Improvement |
|---|---|---|---|---|
| 2025 | $4,341 | $68,300 | $24,238 | $44,062 |
| 2023 | $4,342 | $68,300 | $24,238 | $44,062 |
| 2022 | $3,462 | $48,938 | $13,815 | $35,123 |
| 2021 | $3,214 | $48,938 | $13,815 | $35,123 |
| 2020 | $3,308 | $48,938 | $13,815 | $35,123 |
| 2019 | $3,173 | $42,928 | $12,117 | $30,811 |
| 2018 | $3,177 | $42,928 | $12,117 | $30,811 |
| 2017 | $3,018 | $42,928 | $12,117 | $30,811 |
| 2016 | $3,532 | $49,560 | $12,229 | $37,331 |
| 2015 | $3,184 | $49,560 | $12,229 | $37,331 |
| 2014 | $3,207 | $49,560 | $12,229 | $37,331 |
| 2013 | $2,940 | $44,650 | $11,018 | $33,632 |
Source: Public Records
Map
Nearby Homes
- 2863 Marshall Ave
- 2911 Maisel Dr
- 2963 Deckebach Ave
- 520 Probasco St
- 610 Riddle Rd
- 527 Riddle Rd
- 607 Foulke St
- 517 Riddle Rd
- 3013 Marshall Ave
- 396 Probasco St
- 3011 Riddle View Ln
- 521 Tafel St
- 507 Tafel St
- 3091 Riddle View Ln
- 513 Tafel St
- 760 Straight St
- 2992 W McMicken Ave
- 2728 Digby Ave
- 773 Straight St
- 1050 Marshall Ave
- 630 Probasco St
- 624 Probasco St
- 632 Probasco St
- 638 Probasco St
- 620 Probasco St
- 640 Probasco St
- 618 Probasco St
- 644 Probasco St
- 629 Riddle Rd
- 627 Riddle Rd
- 633 Riddle Rd
- 614 Probasco St
- 631 Probasco St
- 633 Probasco St
- 635 Probasco St
- 637 Probasco St
- 621 Riddle Rd
- 639 Probasco St
- 619 Riddle Rd
- 615 Riddle Rd
Your Personal Tour Guide
Ask me questions while you tour the home.