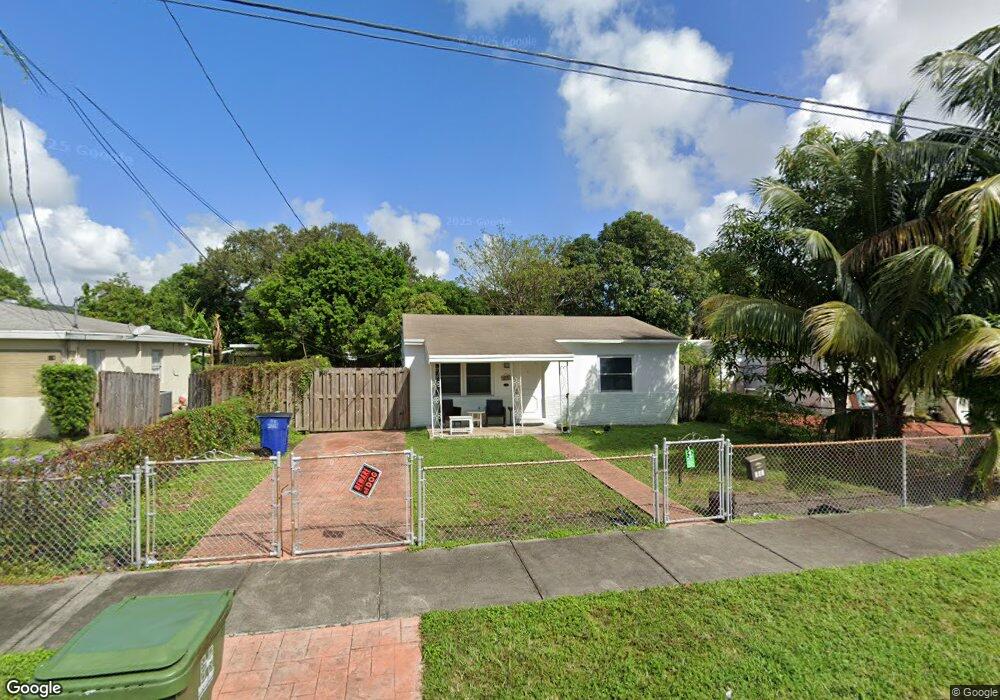
628 SW 10th St Unit 1 Hallandale Beach, FL 33009
Southwest Lakes NeighborhoodEstimated Value: $433,000 - $473,000
2
Beds
1
Bath
750
Sq Ft
$614/Sq Ft
Est. Value
About This Home
This home is located at 628 SW 10th St Unit 1, Hallandale Beach, FL 33009 and is currently estimated at $460,449, approximately $613 per square foot. 628 SW 10th St Unit 1 is a home located in Broward County with nearby schools including Gulfstream Academy of Hallandale Beach, Hallandale High School, and South Broward Montessori Charter School.
Ownership History
Date
Name
Owned For
Owner Type
Purchase Details
Closed on
Aug 31, 2017
Sold by
Bilbao Leopoldo N and De Bilbao Rosa Zoila Febres
Bought by
Jaourabchi Azam
Current Estimated Value
Purchase Details
Closed on
Sep 2, 2013
Sold by
Azulay Investments Llc
Bought by
Bilbao Leopoldo N and Bilbao Rosa Zoila
Purchase Details
Closed on
Jul 23, 2013
Sold by
Rivera Lillian
Bought by
Azulay Investments Llc
Purchase Details
Closed on
Nov 13, 2008
Sold by
Hoffman Martin and Feldman Steven
Bought by
Rivera Lillian
Home Financials for this Owner
Home Financials are based on the most recent Mortgage that was taken out on this home.
Original Mortgage
$121,242
Interest Rate
6.01%
Mortgage Type
FHA
Purchase Details
Closed on
Mar 21, 2008
Sold by
Haines Tracey
Bought by
Hoffman Martin and Feldman Steven
Purchase Details
Closed on
Oct 5, 2002
Sold by
Smith John G
Bought by
Haines Mary E
Create a Home Valuation Report for This Property
The Home Valuation Report is an in-depth analysis detailing your home's value as well as a comparison with similar homes in the area
Home Values in the Area
Average Home Value in this Area
Purchase History
| Date | Buyer | Sale Price | Title Company |
|---|---|---|---|
| Jaourabchi Azam | $199,000 | Global Title Svcs Of South F | |
| Bilbao Leopoldo N | $120,000 | Attorney | |
| Azulay Investments Llc | $72,100 | None Available | |
| Rivera Lillian | $121,900 | Action Title Company | |
| Hoffman Martin | $94,000 | Action Title Company | |
| Haines Mary E | -- | -- |
Source: Public Records
Mortgage History
| Date | Status | Borrower | Loan Amount |
|---|---|---|---|
| Previous Owner | Rivera Lillian | $121,242 |
Source: Public Records
Tax History Compared to Growth
Tax History
| Year | Tax Paid | Tax Assessment Tax Assessment Total Assessment is a certain percentage of the fair market value that is determined by local assessors to be the total taxable value of land and additions on the property. | Land | Improvement |
|---|---|---|---|---|
| 2025 | $8,002 | $337,340 | -- | -- |
| 2024 | $7,233 | $337,340 | $27,580 | $238,310 |
| 2023 | $7,233 | $278,800 | $0 | $0 |
| 2022 | $6,092 | $253,460 | $0 | $0 |
| 2021 | $5,139 | $230,420 | $0 | $0 |
| 2020 | $4,674 | $222,780 | $27,580 | $195,200 |
| 2019 | $4,247 | $194,950 | $27,580 | $167,370 |
| 2018 | $3,673 | $173,130 | $27,580 | $145,550 |
| 2017 | $1,964 | $93,030 | $0 | $0 |
| 2016 | $1,873 | $86,410 | $0 | $0 |
| 2015 | $2,044 | $95,980 | $0 | $0 |
| 2014 | $2,011 | $95,980 | $0 | $0 |
| 2013 | -- | $78,060 | $19,310 | $58,750 |
Source: Public Records
Map
Nearby Homes
- 635 SW 9th St
- 600 SW 10th St
- 512 SW 10th St
- 2380 NE 214th St
- 412 SW 10th St
- 740 SW 9th St
- 713 SW 6th Ave
- 737 SW 8th Ave
- 731 SW 8th Ave
- 623 SW 6th Terrace
- 538 SW 7th St
- 707 SW 8th Ave
- 1012 SW 3rd Ave
- 2510 NE 215th St
- 621 SW 5th Ct
- 21440 Highland Lakes Blvd
- 844 SW 10th St
- 2362 NE 212th Terrace
- 601 SW 5th Ct
- 21250 NE 23rd Ave