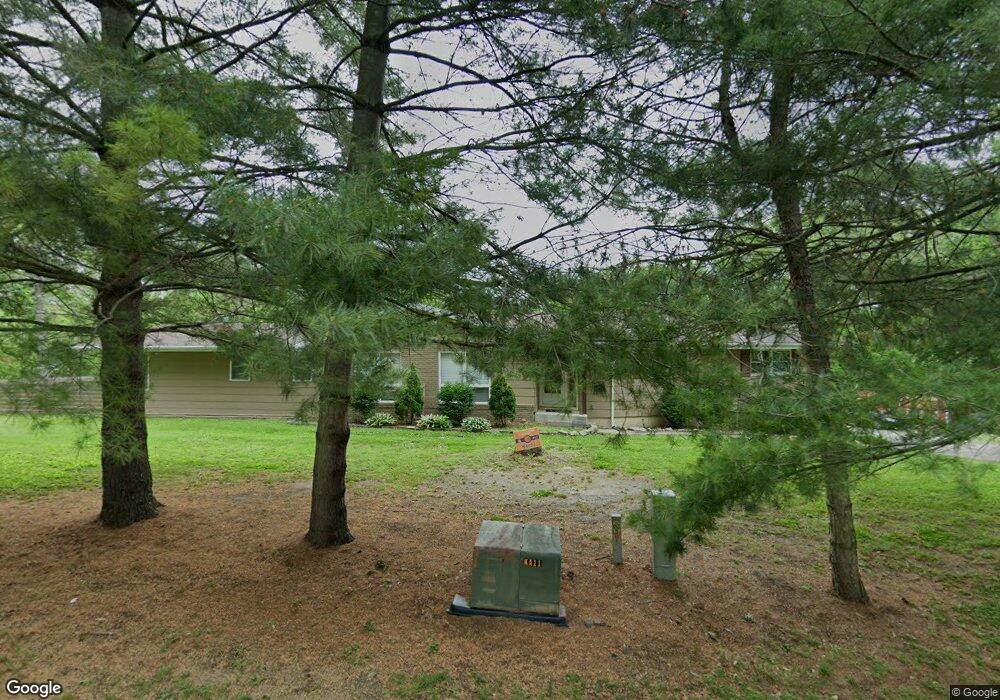
628 Twin Oaks St Oakland, IL 61943
Estimated Value: $149,000 - $298,000
3
Beds
3
Baths
1,644
Sq Ft
$137/Sq Ft
Est. Value
About This Home
This home is located at 628 Twin Oaks St, Oakland, IL 61943 and is currently estimated at $224,945, approximately $136 per square foot. 628 Twin Oaks St is a home located in Coles County with nearby schools including Lake Crest Elementary School and Oakland High School.
Ownership History
Date
Name
Owned For
Owner Type
Purchase Details
Closed on
May 10, 2021
Sold by
Johnson Tyler K and Johnson Cassie L
Bought by
Helander Jason C and Helander Amanda S
Current Estimated Value
Home Financials for this Owner
Home Financials are based on the most recent Mortgage that was taken out on this home.
Original Mortgage
$193,800
Outstanding Balance
$175,631
Interest Rate
3.1%
Mortgage Type
New Conventional
Estimated Equity
$49,314
Purchase Details
Closed on
Jun 10, 2016
Sold by
Johnson Tyler K and Johnson Cassie L
Bought by
Johnson Tyler K and Johnson Cassie L
Purchase Details
Closed on
Oct 1, 2012
Sold by
Denk Mark A and Denk Elizabeth A
Bought by
Taylor Cassie L
Home Financials for this Owner
Home Financials are based on the most recent Mortgage that was taken out on this home.
Original Mortgage
$88,000
Interest Rate
3.5%
Mortgage Type
New Conventional
Create a Home Valuation Report for This Property
The Home Valuation Report is an in-depth analysis detailing your home's value as well as a comparison with similar homes in the area
Home Values in the Area
Average Home Value in this Area
Purchase History
| Date | Buyer | Sale Price | Title Company |
|---|---|---|---|
| Helander Jason C | $204,000 | Attorney | |
| Johnson Tyler K | -- | Coles County Title | |
| Taylor Cassie L | $83,000 | None Available |
Source: Public Records
Mortgage History
| Date | Status | Borrower | Loan Amount |
|---|---|---|---|
| Open | Helander Jason C | $193,800 | |
| Previous Owner | Taylor Cassie L | $88,000 |
Source: Public Records
Tax History Compared to Growth
Tax History
| Year | Tax Paid | Tax Assessment Tax Assessment Total Assessment is a certain percentage of the fair market value that is determined by local assessors to be the total taxable value of land and additions on the property. | Land | Improvement |
|---|---|---|---|---|
| 2024 | $5,354 | $68,000 | $7,994 | $60,006 |
| 2023 | $5,342 | $68,000 | $7,994 | $60,006 |
| 2022 | $5,320 | $57,426 | $8,846 | $48,580 |
| 2021 | $4,632 | $51,899 | $7,995 | $43,904 |
| 2020 | $2,443 | $30,909 | $8,284 | $22,625 |
| 2019 | $2,428 | $29,832 | $6,696 | $23,136 |
| 2018 | $2,426 | $35,686 | $6,696 | $28,990 |
| 2017 | $2,504 | $35,686 | $6,696 | $28,990 |
| 2016 | $2,562 | $29,832 | $6,696 | $23,136 |
| 2015 | $3,744 | $29,832 | $6,696 | $23,136 |
| 2014 | $3,744 | $29,832 | $6,696 | $23,136 |
| 2013 | $3,744 | $29,832 | $6,696 | $23,136 |
Source: Public Records
Map
Nearby Homes
- 509 Lakeshore Dr
- 215 Silver St
- 512 Norton Dr
- 312 Ashmore Rd
- 100 N Reel St
- 22518 State Highway 133
- 0 E Co Road 1550 N
- Moody Rd Unit Lot WP001
- County Road 1550 N
- 206 S Boyer Ave
- 0 County Road 2300 Rd E Unit 24630606
- 0 County Road 2300 Rd E Unit RMAPA1260552
- 212 Michigan St
- 18428 E Co Road 1500 N
- 20315 Airtight Rd
- 2445 E County Road 875 N
- 210 Buena Vista St
- 137 E Buena Vista St
- 509 E Jefferson St
- 109 Center St
- 625 Twin Oaks St
- 705 Twin Oaks St
- 620 Twin Oaks St
- 604 Twin Oaks St
- 626 Maple St
- 25181 E Blevins St
- 706 Maple St
- 622 Maple St
- 614 Twin Oaks St
- 709 Maple St
- 25123 E Blevins St
- 515 Hickory St
- 701 Maple St
- 627 Maple St
- 705 Maple St
- 617 Maple St
- 0 Maple St
- 25093 E Blevins St
- 513 Lakeshore Dr
- 634 Maple St