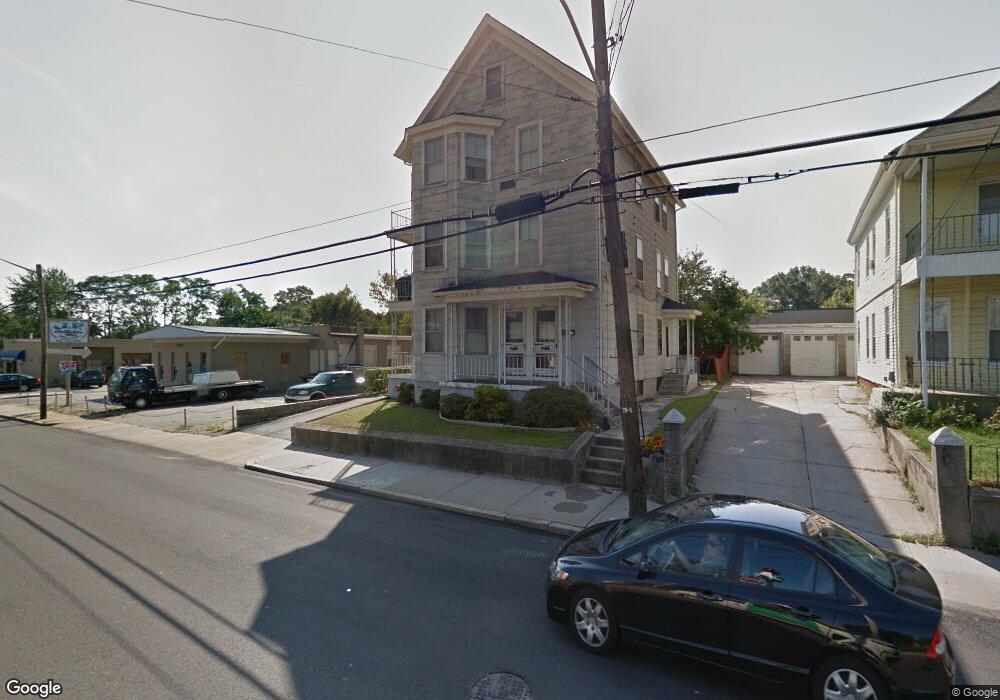
628 Weeden St Pawtucket, RI 02860
Fairlawn NeighborhoodEstimated Value: $434,653 - $592,000
6
Beds
3
Baths
5,037
Sq Ft
$108/Sq Ft
Est. Value
About This Home
This home is located at 628 Weeden St, Pawtucket, RI 02860 and is currently estimated at $541,663, approximately $107 per square foot. 628 Weeden St is a home located in Providence County with nearby schools including Blackstone Valley Prep Upper Elementary School, Blackstone Valley Prep Junior High School, and Bishop Keough Regional High School.
Ownership History
Date
Name
Owned For
Owner Type
Purchase Details
Closed on
Jan 6, 2023
Sold by
Mahoney John E
Bought by
Goncalves George C
Current Estimated Value
Home Financials for this Owner
Home Financials are based on the most recent Mortgage that was taken out on this home.
Original Mortgage
$280,500
Outstanding Balance
$270,290
Interest Rate
6.58%
Mortgage Type
Purchase Money Mortgage
Estimated Equity
$271,373
Purchase Details
Closed on
Jan 15, 2019
Sold by
Wood David
Bought by
Mahoney John E
Home Financials for this Owner
Home Financials are based on the most recent Mortgage that was taken out on this home.
Original Mortgage
$127,600
Interest Rate
4.7%
Mortgage Type
New Conventional
Purchase Details
Closed on
Dec 4, 2014
Sold by
Santander Bank
Bought by
Wood David
Create a Home Valuation Report for This Property
The Home Valuation Report is an in-depth analysis detailing your home's value as well as a comparison with similar homes in the area
Home Values in the Area
Average Home Value in this Area
Purchase History
| Date | Buyer | Sale Price | Title Company |
|---|---|---|---|
| Goncalves George C | $330,000 | None Available | |
| Mahoney John E | $159,500 | -- | |
| Wood David | $81,000 | -- | |
| Wood David | $81,000 | -- |
Source: Public Records
Mortgage History
| Date | Status | Borrower | Loan Amount |
|---|---|---|---|
| Open | Goncalves George C | $280,500 | |
| Previous Owner | Mahoney John E | $127,600 | |
| Previous Owner | Wood David | $195,000 | |
| Previous Owner | Wood David | $75,000 | |
| Previous Owner | Wood David | $50,000 |
Source: Public Records
Tax History
| Year | Tax Paid | Tax Assessment Tax Assessment Total Assessment is a certain percentage of the fair market value that is determined by local assessors to be the total taxable value of land and additions on the property. | Land | Improvement |
|---|---|---|---|---|
| 2025 | $5,569 | $423,500 | $117,000 | $306,500 |
| 2024 | $5,153 | $417,600 | $117,000 | $300,600 |
| 2023 | $4,765 | $281,300 | $70,600 | $210,700 |
| 2022 | $4,664 | $281,300 | $70,600 | $210,700 |
| 2021 | $4,664 | $281,300 | $70,600 | $210,700 |
| 2020 | $3,627 | $173,600 | $49,500 | $124,100 |
| 2019 | $3,627 | $173,600 | $49,500 | $124,100 |
| 2018 | $3,495 | $173,600 | $49,500 | $124,100 |
| 2017 | $3,640 | $160,200 | $52,600 | $107,600 |
| 2016 | $3,507 | $160,200 | $52,600 | $107,600 |
| 2015 | $3,507 | $160,200 | $52,600 | $107,600 |
| 2014 | $2,834 | $122,900 | $52,600 | $70,300 |
Source: Public Records
Map
Nearby Homes
- 584 Weeden St
- 53 Samuel Ave
- 122 Elder St
- 16 Rufus St
- 121 Samuel Ave
- 63 Chandler Ave
- 75 Larch St
- 53 Francis Ave
- 75 Baldwin St
- 458 Smithfield Ave
- 102 Francis Ave
- 8 Arnold Ave
- 18 Almy St
- 53 Oriole Ave
- 2 Cobble Hill Rd
- 546 Lonsdale Ave Unit 548
- 27 Lloyd St
- 616 Lonsdale Ave Unit 618
- 26 Smith St
- 220 Francis Ave
Your Personal Tour Guide
Ask me questions while you tour the home.