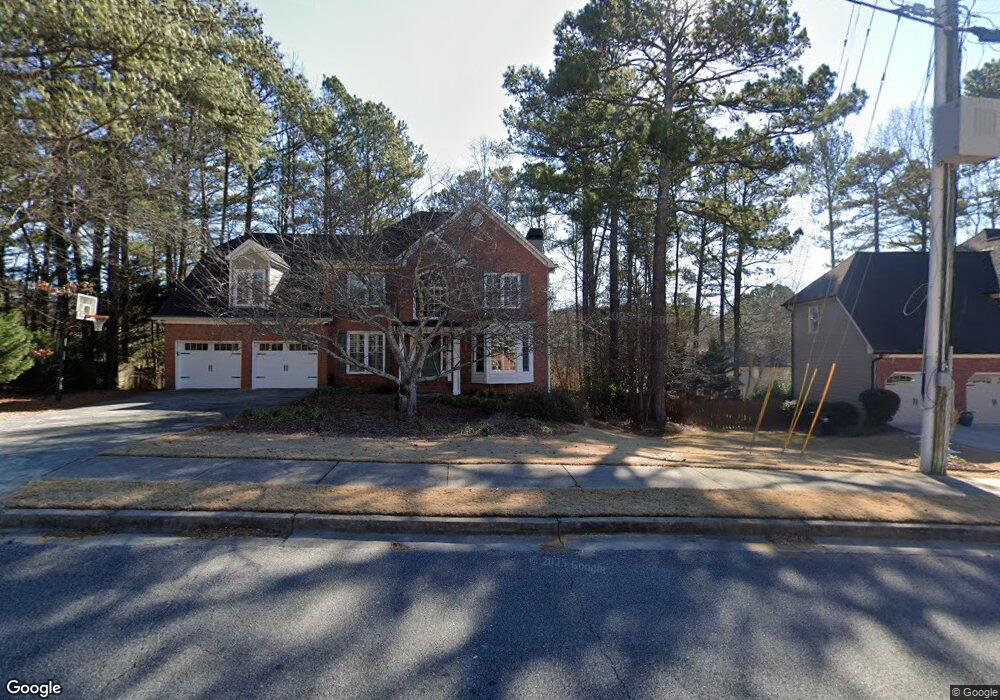
6281 Woodlore Dr NW Acworth, GA 30101
West Cobb NeighborhoodEstimated Value: $531,000 - $564,000
5
Beds
3
Baths
2,495
Sq Ft
$217/Sq Ft
Est. Value
About This Home
This home is located at 6281 Woodlore Dr NW, Acworth, GA 30101 and is currently estimated at $541,482, approximately $217 per square foot. 6281 Woodlore Dr NW is a home located in Cobb County with nearby schools including Vaughan Elementary School, Lost Mountain Middle School, and Harrison High School.
Ownership History
Date
Name
Owned For
Owner Type
Purchase Details
Closed on
Mar 30, 2011
Sold by
American Intl Relocation Solu
Bought by
Langston Robert D and Langston Dana A
Current Estimated Value
Home Financials for this Owner
Home Financials are based on the most recent Mortgage that was taken out on this home.
Original Mortgage
$166,400
Outstanding Balance
$115,603
Interest Rate
4.95%
Mortgage Type
New Conventional
Estimated Equity
$425,879
Purchase Details
Closed on
Aug 17, 2007
Sold by
Moore Jerry W and Moore Glenda K
Bought by
Bear Christopher C and Bear Mary C
Home Financials for this Owner
Home Financials are based on the most recent Mortgage that was taken out on this home.
Original Mortgage
$168,000
Interest Rate
6.65%
Mortgage Type
New Conventional
Purchase Details
Closed on
Jul 15, 1994
Sold by
Dowis Chamberlin Bldrs
Bought by
Moore Jerry W Glenda K
Create a Home Valuation Report for This Property
The Home Valuation Report is an in-depth analysis detailing your home's value as well as a comparison with similar homes in the area
Home Values in the Area
Average Home Value in this Area
Purchase History
| Date | Buyer | Sale Price | Title Company |
|---|---|---|---|
| Langston Robert D | $208,000 | -- | |
| American Intl Relocation Solu | $208,000 | -- | |
| Bear Christopher C | $288,000 | -- | |
| Moore Jerry W Glenda K | $161,900 | -- |
Source: Public Records
Mortgage History
| Date | Status | Borrower | Loan Amount |
|---|---|---|---|
| Open | American Intl Relocation Solu | $166,400 | |
| Previous Owner | Bear Christopher C | $168,000 |
Source: Public Records
Tax History Compared to Growth
Tax History
| Year | Tax Paid | Tax Assessment Tax Assessment Total Assessment is a certain percentage of the fair market value that is determined by local assessors to be the total taxable value of land and additions on the property. | Land | Improvement |
|---|---|---|---|---|
| 2024 | $4,106 | $170,620 | $46,000 | $124,620 |
| 2023 | $3,875 | $184,968 | $34,000 | $150,968 |
| 2022 | $3,977 | $163,236 | $24,000 | $139,236 |
| 2021 | $3,219 | $128,632 | $24,000 | $104,632 |
| 2020 | $2,975 | $117,468 | $24,000 | $93,468 |
| 2019 | $2,975 | $117,468 | $24,000 | $93,468 |
| 2018 | $2,779 | $108,528 | $24,000 | $84,528 |
| 2017 | $2,671 | $108,528 | $24,000 | $84,528 |
| 2016 | $2,215 | $87,704 | $24,000 | $63,704 |
| 2015 | $2,269 | $87,704 | $24,000 | $63,704 |
| 2014 | $2,287 | $87,704 | $0 | $0 |
Source: Public Records
Map
Nearby Homes
- 6100 Braidwood Ct NW
- 691 Braidwood Terrace NW
- 6017 Chestatee Creek Ct NW
- 6246 Braidwood Way NW
- 6211 Woodlore Dr NW
- 582 Braidwood Dr NW
- 6049 Braidwood Close NW Unit 5
- 654 Braidwood Dr NW
- 5900 Pavillion Dr
- 6280 Wiscasset Pkwy NW
- 5725 Fairwood Dr NW
- 6011 Fairlong Ct NW
- 956 Fairlong Dr NW
- 3391 Due Rd W
- 0 Paige St
- 863 Fairwood Pointe NW
- 6049 Wyndham Woods Dr
- 870 Fairwood Pointe NW
- 6285 Woodlore Dr NW Unit 1
- 609 Braidwood Dr NW
- 6114 Braidwood Ln NW
- 6112 Braidwood Ln NW Unit 1
- 6116 Braidwood Ln NW
- 6287 Woodlore Dr NW Unit 2
- 6282 Woodlore Dr NW
- 611 Braidwood Dr NW Unit 6
- 6286 Woodlore Dr NW Unit 6
- 607 Braidwood Dr NW Unit 1
- 6118 Braidwood Ln NW Unit 2
- 6289 Woodlore Dr NW Unit II
- 614 Braidwood Dr NW
- 6115 Braidwood Ln NW
- 6120 Braidwood Ln NW
- 6292 Woodlore Dr NW
- 612 Braidwood Dr NW
- 3137 Braidwood Ln
- 622 Braidwood Pte NW
- 622 Braidwood Nw Pointe