Estimated Value: $653,881 - $805,000
5
Beds
3
Baths
3,371
Sq Ft
$214/Sq Ft
Est. Value
About This Home
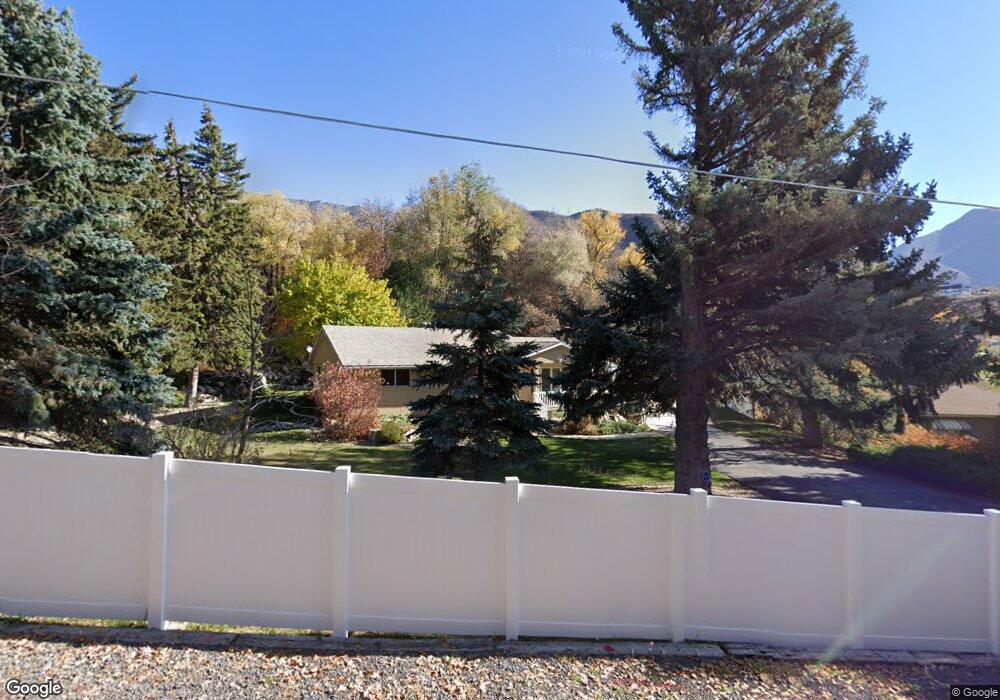
This home is located at 6282 Combe Rd, Ogden, UT 84403 and is currently estimated at $720,220, approximately $213 per square foot. 6282 Combe Rd is a home located in Weber County with nearby schools including Uintah School, South Ogden Junior High School, and Bonneville High School.
Ownership History
Date
Name
Owned For
Owner Type
Purchase Details
Closed on
Feb 22, 2012
Sold by
Nichols Roger C and Nichols Shirlee
Bought by
Nichols Roger C and Nichols Shirlee
Current Estimated Value
Purchase Details
Closed on
Sep 1, 2010
Sold by
Nichols Roger C and Nichols Shirlee
Bought by
Nichols Roger C and Nichols Shirlee
Purchase Details
Closed on
Jan 15, 2003
Sold by
Dufault Arthur W
Bought by
Nichols Roger C and Nichols Shirlee
Home Financials for this Owner
Home Financials are based on the most recent Mortgage that was taken out on this home.
Original Mortgage
$128,000
Interest Rate
6.15%
Purchase Details
Closed on
Aug 4, 1998
Sold by
Lower Barry L and Lower Judy L
Bought by
Dufault Arthur W
Home Financials for this Owner
Home Financials are based on the most recent Mortgage that was taken out on this home.
Original Mortgage
$135,000
Interest Rate
6.54%
Create a Home Valuation Report for This Property
The Home Valuation Report is an in-depth analysis detailing your home's value as well as a comparison with similar homes in the area
Purchase History
| Date | Buyer | Sale Price | Title Company |
|---|---|---|---|
| Nichols Roger C | -- | None Available | |
| Nichols Roger C | -- | Utah Commercial Title | |
| Nichols Roger C | -- | Mountain View Title | |
| Dufault Arthur W | -- | Associated Title |
Source: Public Records
Mortgage History
| Date | Status | Borrower | Loan Amount |
|---|---|---|---|
| Previous Owner | Nichols Roger C | $128,000 | |
| Previous Owner | Dufault Arthur W | $135,000 |
Source: Public Records
Tax History
| Year | Tax Paid | Tax Assessment Tax Assessment Total Assessment is a certain percentage of the fair market value that is determined by local assessors to be the total taxable value of land and additions on the property. | Land | Improvement |
|---|---|---|---|---|
| 2025 | $3,666 | $670,088 | $253,498 | $416,590 |
| 2024 | $3,411 | $360,799 | $139,423 | $221,376 |
| 2023 | $3,338 | $348,700 | $139,424 | $209,276 |
| 2022 | $3,469 | $369,050 | $100,333 | $268,717 |
| 2021 | $2,468 | $492,000 | $106,795 | $385,205 |
| 2020 | $2,258 | $415,000 | $91,316 | $323,684 |
| 2019 | $2,152 | $374,000 | $81,314 | $292,686 |
| 2018 | $2,104 | $350,000 | $81,314 | $268,686 |
| 2017 | $2,041 | $324,000 | $73,295 | $250,705 |
| 2016 | $1,908 | $164,978 | $36,428 | $128,550 |
| 2015 | $1,732 | $146,700 | $34,780 | $111,920 |
| 2014 | $1,588 | $133,328 | $34,780 | $98,548 |
Source: Public Records
Map
Nearby Homes
- 6313 Bybee Dr
- 6124 Osmond Dr
- 6548 Bybee Dr Unit 3
- 2257 E Parkside Cir
- 2291 E Parkside Cir
- 2632 E 6025 S
- 2553 E 6550 S
- 6464 Bybee Dr
- 2921 Melanie Ln
- 6541 S 2175 E
- 2237 E Parkside Cir
- 2340 E 5950 S
- 5924 S 2950 St E Unit 11
- 2616 Bonneville Terrace Dr
- 1995 E 6225 S
- 5685 S Village Cir
- 7212 S Harolds Way
- 5780 Village Way
- 5538 Elderberry Ct
- 5973 S South Weber Dr
Your Personal Tour Guide
Ask me questions while you tour the home.