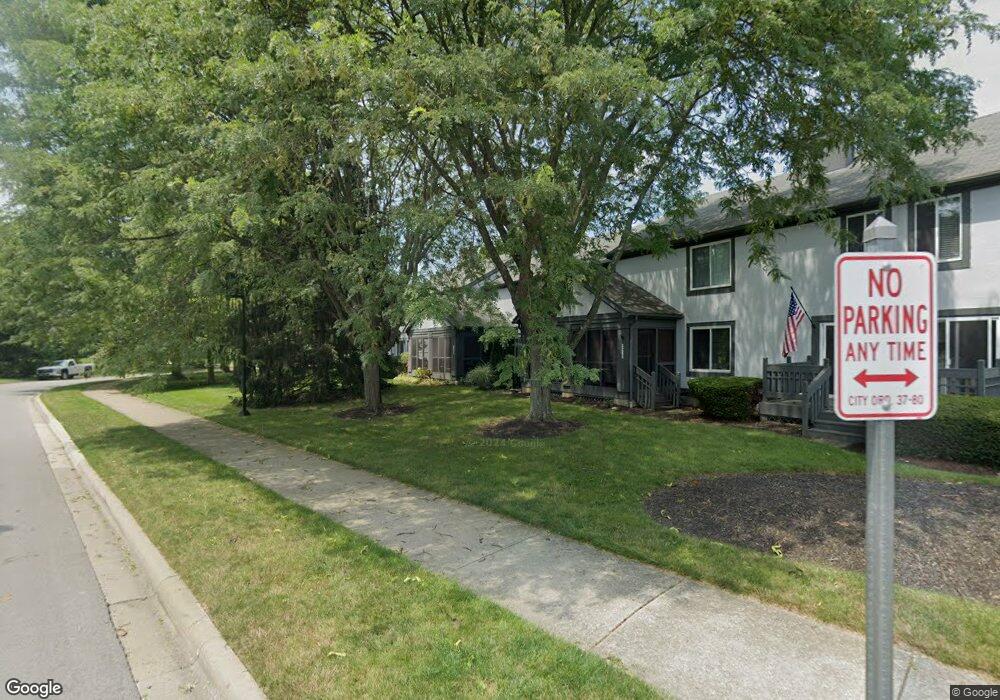
6282 Hyland Dr Dublin, OH 43017
Estimated Value: $306,177 - $318,000
2
Beds
2
Baths
1,280
Sq Ft
$244/Sq Ft
Est. Value
About This Home
This home is located at 6282 Hyland Dr, Dublin, OH 43017 and is currently estimated at $312,294, approximately $243 per square foot. 6282 Hyland Dr is a home located in Franklin County with nearby schools including Scottish Corners Elementary School, Henry Karrer Middle School, and Dublin Coffman High School.
Ownership History
Date
Name
Owned For
Owner Type
Purchase Details
Closed on
Jul 24, 2025
Sold by
Douglas Gretchen and Hagarman Gretchen L
Bought by
Gretchen L Hagarman Family Trust and Hagarman
Current Estimated Value
Purchase Details
Closed on
Jun 5, 2014
Sold by
Douglas Brian J and Douglas Gretchen L
Bought by
Douglas Gretchen
Home Financials for this Owner
Home Financials are based on the most recent Mortgage that was taken out on this home.
Original Mortgage
$114,750
Interest Rate
4.18%
Mortgage Type
New Conventional
Purchase Details
Closed on
May 31, 2005
Sold by
I/M Development Co
Bought by
Douglas Brian J and Douglas Gretchen L
Home Financials for this Owner
Home Financials are based on the most recent Mortgage that was taken out on this home.
Original Mortgage
$126,100
Interest Rate
5.91%
Mortgage Type
Purchase Money Mortgage
Purchase Details
Closed on
Aug 20, 1985
Bought by
I/M Development Co
Create a Home Valuation Report for This Property
The Home Valuation Report is an in-depth analysis detailing your home's value as well as a comparison with similar homes in the area
Home Values in the Area
Average Home Value in this Area
Purchase History
| Date | Buyer | Sale Price | Title Company |
|---|---|---|---|
| Gretchen L Hagarman Family Trust | -- | None Listed On Document | |
| Douglas Gretchen | -- | Clean Title | |
| Douglas Brian J | $148,500 | Hummel Titl | |
| I/M Development Co | -- | -- |
Source: Public Records
Mortgage History
| Date | Status | Borrower | Loan Amount |
|---|---|---|---|
| Previous Owner | Douglas Gretchen | $114,750 | |
| Previous Owner | Douglas Brian J | $126,100 |
Source: Public Records
Tax History Compared to Growth
Tax History
| Year | Tax Paid | Tax Assessment Tax Assessment Total Assessment is a certain percentage of the fair market value that is determined by local assessors to be the total taxable value of land and additions on the property. | Land | Improvement |
|---|---|---|---|---|
| 2024 | $5,446 | $83,830 | $18,200 | $65,630 |
| 2023 | $5,371 | $83,825 | $18,200 | $65,625 |
| 2022 | $4,151 | $59,230 | $12,080 | $47,150 |
| 2021 | $4,162 | $59,230 | $12,080 | $47,150 |
| 2020 | $4,196 | $59,230 | $12,080 | $47,150 |
| 2019 | $4,124 | $51,490 | $10,500 | $40,990 |
| 2018 | $4,127 | $51,490 | $10,500 | $40,990 |
| 2017 | $3,962 | $51,490 | $10,500 | $40,990 |
| 2016 | $4,085 | $51,450 | $10,500 | $40,950 |
| 2015 | $4,111 | $51,450 | $10,500 | $40,950 |
| 2014 | $4,116 | $51,450 | $10,500 | $40,950 |
| 2013 | $2,094 | $51,450 | $10,500 | $40,950 |
Source: Public Records
Map
Nearby Homes
- 6987 Dublin Village Dr
- 6956 Avery Rd
- 9786 Mesquite Ct
- 6937 Dublin Village Dr
- 6282 Twonotch Ct
- 7246 Sundown Ct
- 6088 Holywell Dr
- 7326 Pueblo Ct
- 6345 Angeles Dr
- 6369 Angeles Dr
- 6363 Phoenix Park Dr
- 7199 Achill Dr
- 5912 Tara Hill Dr
- 6992 Beery Ln
- 7307 Tullymore Dr
- 7470 Tullymore Dr
- 7168 Innisfree Ct
- 5735 McNeven Ct
- 7689 Johntimm Ct
- 6117 Craughwell Ln