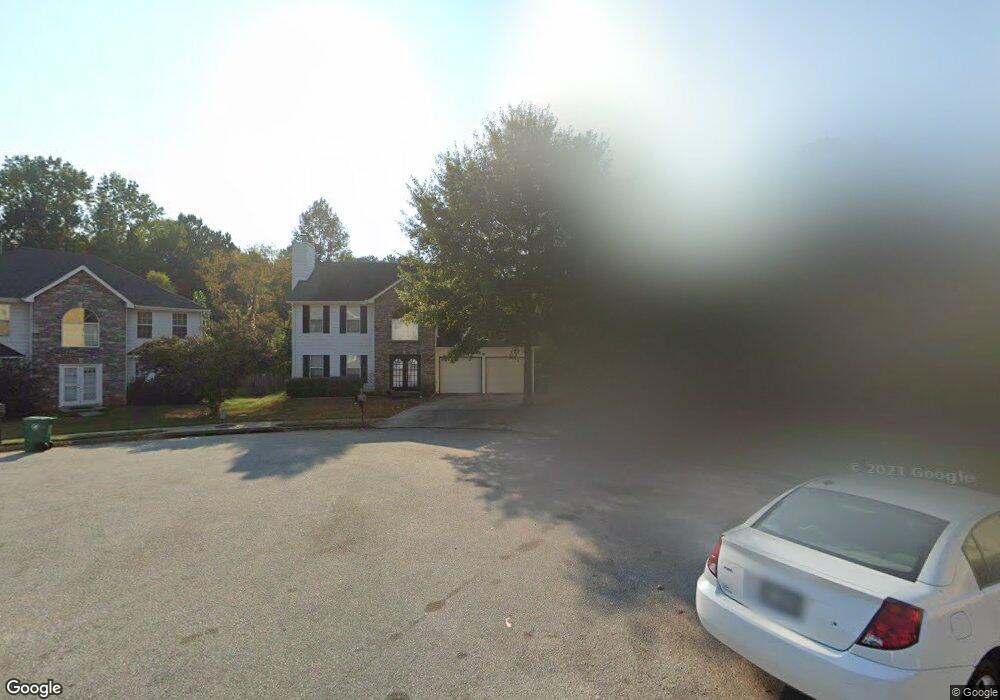
6285 Sayler Park Lithonia, GA 30058
Estimated Value: $254,845 - $299,000
3
Beds
3
Baths
2,098
Sq Ft
$129/Sq Ft
Est. Value
About This Home
This home is located at 6285 Sayler Park, Lithonia, GA 30058 and is currently estimated at $269,711, approximately $128 per square foot. 6285 Sayler Park is a home located in DeKalb County with nearby schools including Redan Elementary School, Lithonia Middle School, and Lithonia High School.
Ownership History
Date
Name
Owned For
Owner Type
Purchase Details
Closed on
Jan 8, 2020
Sold by
Mcduffie Stacy
Bought by
Mcduffie Ayanna
Current Estimated Value
Purchase Details
Closed on
Mar 24, 2010
Sold by
Hsbc Mtg Svcs Inc
Bought by
Mcduffie Stacy
Home Financials for this Owner
Home Financials are based on the most recent Mortgage that was taken out on this home.
Original Mortgage
$89,351
Interest Rate
5.25%
Mortgage Type
FHA
Purchase Details
Closed on
Nov 3, 2009
Sold by
Douthit Audra
Bought by
Hsbc Mtg Svcs Inc
Purchase Details
Closed on
Jan 6, 2004
Sold by
Washington Mutual Bk Fa
Bought by
Hud
Purchase Details
Closed on
Sep 18, 2001
Sold by
Giles Dev Co Inc
Bought by
Smith Corey D
Home Financials for this Owner
Home Financials are based on the most recent Mortgage that was taken out on this home.
Original Mortgage
$148,700
Interest Rate
6.97%
Mortgage Type
FHA
Create a Home Valuation Report for This Property
The Home Valuation Report is an in-depth analysis detailing your home's value as well as a comparison with similar homes in the area
Home Values in the Area
Average Home Value in this Area
Purchase History
| Date | Buyer | Sale Price | Title Company |
|---|---|---|---|
| Mcduffie Ayanna | -- | -- | |
| Mcduffie Stacy | $91,000 | -- | |
| Hsbc Mtg Svcs Inc | $76,882 | -- | |
| Hud | -- | -- | |
| Washington Mutual Bk Fa | $168,729 | -- | |
| Smith Corey D | $150,000 | -- |
Source: Public Records
Mortgage History
| Date | Status | Borrower | Loan Amount |
|---|---|---|---|
| Previous Owner | Mcduffie Stacy | $89,351 | |
| Previous Owner | Smith Corey D | $148,700 |
Source: Public Records
Tax History Compared to Growth
Tax History
| Year | Tax Paid | Tax Assessment Tax Assessment Total Assessment is a certain percentage of the fair market value that is determined by local assessors to be the total taxable value of land and additions on the property. | Land | Improvement |
|---|---|---|---|---|
| 2025 | $3,000 | $103,760 | $15,000 | $88,760 |
| 2024 | $3,055 | $102,640 | $15,000 | $87,640 |
| 2023 | $3,055 | $88,680 | $15,000 | $73,680 |
| 2022 | $2,866 | $97,280 | $15,000 | $82,280 |
| 2021 | $2,298 | $72,640 | $10,000 | $62,640 |
| 2020 | $2,952 | $59,440 | $10,000 | $49,440 |
| 2019 | $2,766 | $55,200 | $10,000 | $45,200 |
| 2018 | $2,523 | $58,600 | $10,000 | $48,600 |
| 2017 | $2,479 | $48,440 | $4,560 | $43,880 |
| 2016 | $2,405 | $46,640 | $4,560 | $42,080 |
| 2014 | $1,863 | $33,560 | $4,560 | $29,000 |
Source: Public Records
Map
Nearby Homes
- 6238 Phillips Lake Ct
- 6240 Giles Rd
- 6232 Springwater Ln Unit 1
- 6124 Waterton Dr Unit 1
- 1884 Plainsboro Dr
- 6653 Eastbriar Dr
- 1871 Plainsboro Dr
- 6347 Princeton Ridge Dr
- 6102 Waterton Dr
- 6350 Princeton Ridge Dr
- 6322 Scudders Dr
- 6415 Shalks Crossing Dr
- 2123 Lown Farm Ln
- 6380 Phillips Place
- 6060 Waterton Dr
- 1760 Waterton Ln
- 1691 Redan W
- 2039 Raintree Place
- 2045 Lown Farm Trail Unit 3
- 6351 Stablewood Way
- 6286 Sayler Park
- 6281 Sayler Park
- 6261 Remington Park
- 6258 Remington Park
- 6277 Sayler Park
- 6282 Sayler Park
- 6259 Remington Park
- 6284 Katelyn Park
- 6280 Katelyn Park
- 6278 Sayler Park
- 6269 Sayler Park
- 6252 Remington Park
- 6272 Sayler Park
- 6253 Remington Park
- 6274 Katelyn Park Unit 43
- 6274 Katelyn Park
- 6283 Katelyn Park
- 6263 Sayler Park
- 6246 Remington Park
- 6266 Sayler Park