Estimated Value: $126,000 - $163,144
2
Beds
1
Bath
1,083
Sq Ft
$136/Sq Ft
Est. Value
About This Home
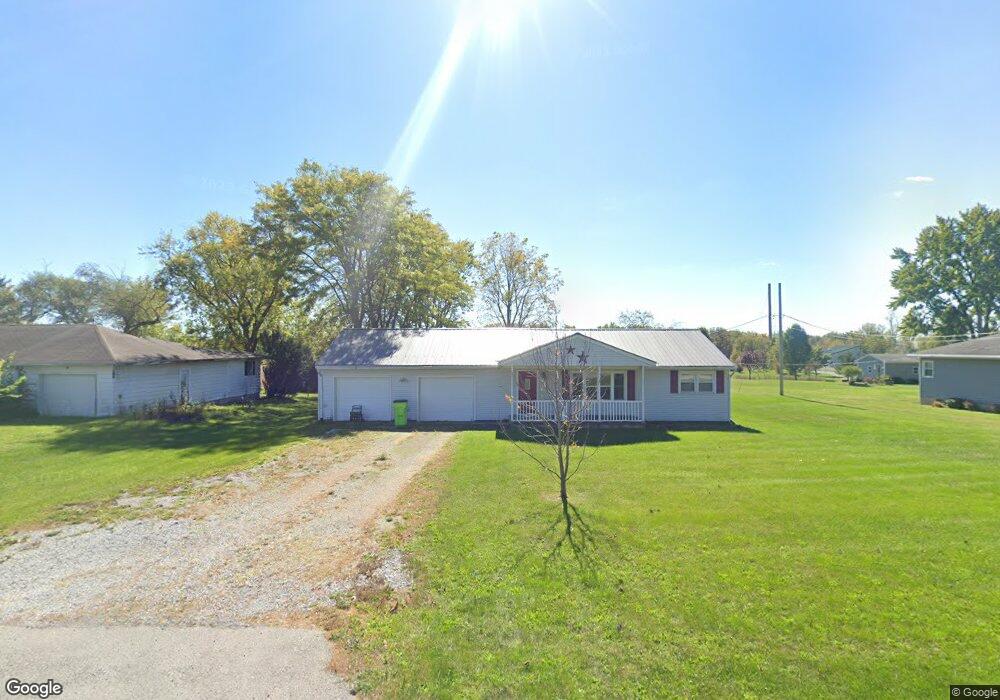
This home is located at 6288 McPheron Rd, Lima, OH 45804 and is currently estimated at $147,286, approximately $135 per square foot. 6288 McPheron Rd is a home located in Allen County with nearby schools including Allen East Elementary School, Allen East Middle School, and Allen East High School.
Ownership History
Date
Name
Owned For
Owner Type
Purchase Details
Closed on
Jan 28, 2016
Sold by
Morris Dustin M and Morris Amanda G
Bought by
Stimmel Scott R
Current Estimated Value
Home Financials for this Owner
Home Financials are based on the most recent Mortgage that was taken out on this home.
Original Mortgage
$35,000
Outstanding Balance
$15,088
Interest Rate
3.97%
Mortgage Type
New Conventional
Estimated Equity
$132,198
Purchase Details
Closed on
Feb 20, 2013
Sold by
Morris Amanda G and Morris Dustin M
Bought by
Morris Dustin M and Morris Amanda G
Purchase Details
Closed on
May 20, 2011
Sold by
Empire Group Llc
Bought by
Stimmel Amanda
Purchase Details
Closed on
Aug 13, 2007
Sold by
Stimmel Marilyn R
Bought by
Empire Group Llc
Purchase Details
Closed on
Apr 9, 1993
Sold by
Knotts Galen J
Bought by
Stimmel Marilyn R
Purchase Details
Closed on
Feb 17, 1987
Bought by
Knotts Galen J
Create a Home Valuation Report for This Property
The Home Valuation Report is an in-depth analysis detailing your home's value as well as a comparison with similar homes in the area
Home Values in the Area
Average Home Value in this Area
Purchase History
| Date | Buyer | Sale Price | Title Company |
|---|---|---|---|
| Stimmel Scott R | $72,000 | None Available | |
| Morris Dustin M | -- | None Available | |
| Stimmel Amanda | $43,000 | Attorney | |
| Empire Group Llc | -- | None Available | |
| Stimmel Marilyn R | $50,000 | -- | |
| Knotts Galen J | -- | -- |
Source: Public Records
Mortgage History
| Date | Status | Borrower | Loan Amount |
|---|---|---|---|
| Open | Stimmel Scott R | $35,000 |
Source: Public Records
Tax History Compared to Growth
Tax History
| Year | Tax Paid | Tax Assessment Tax Assessment Total Assessment is a certain percentage of the fair market value that is determined by local assessors to be the total taxable value of land and additions on the property. | Land | Improvement |
|---|---|---|---|---|
| 2024 | $1,657 | $39,800 | $8,650 | $31,150 |
| 2023 | $1,059 | $27,440 | $5,950 | $21,490 |
| 2022 | $1,083 | $27,440 | $5,950 | $21,490 |
| 2021 | $1,068 | $27,440 | $5,950 | $21,490 |
| 2020 | $1,283 | $25,900 | $5,600 | $20,300 |
| 2019 | $1,283 | $25,900 | $5,600 | $20,300 |
| 2018 | $995 | $25,900 | $5,600 | $20,300 |
| 2017 | $952 | $23,140 | $5,600 | $17,540 |
| 2016 | $925 | $23,140 | $5,600 | $17,540 |
| 2015 | $924 | $23,140 | $5,600 | $17,540 |
| 2014 | $1,078 | $26,080 | $5,320 | $20,760 |
| 2013 | $902 | $22,400 | $5,320 | $17,080 |
Source: Public Records
Map
Nearby Homes
- 6381 McPheron Rd
- 6480 McPheron Rd
- 6616 Bellefontaine Rd
- 7165 Faulkner Rd
- 5600 E Hanthorn Rd
- E Hanthorn Rd
- 1855 S Cool Rd
- 4160 E Hanthorn Rd
- 4080 Bellefontaine Rd
- 5065 Amherst Rd
- 3080 E Hanthorn Rd
- 4786 Harding Hwy
- 303 Pinewood Cir
- 211 Pinewood Cir
- 222 Pinewood Cir
- 304 Pinewood Cir
- 200 S Main St
- 8150 Amherst Rd
- 485 S Mumaugh Rd
- 573 Waterview Cir