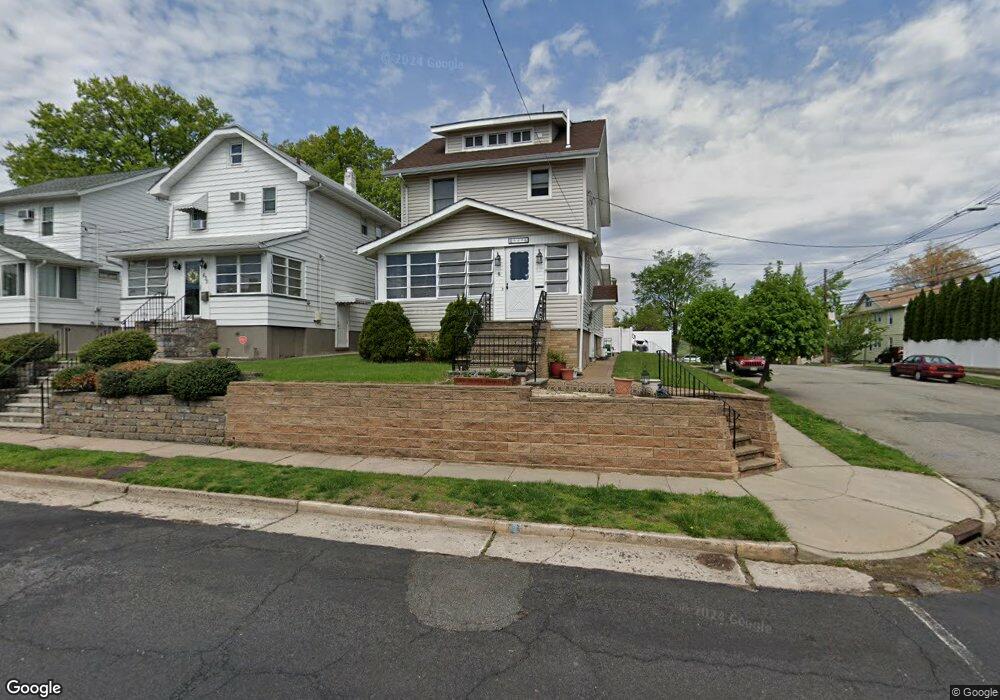
629 7th St Lyndhurst, NJ 07071
Estimated Value: $571,000 - $626,000
3
Beds
2
Baths
1,215
Sq Ft
$487/Sq Ft
Est. Value
About This Home
This home is located at 629 7th St, Lyndhurst, NJ 07071 and is currently estimated at $591,687, approximately $486 per square foot. 629 7th St is a home located in Bergen County with nearby schools including Lyndhurst High School and Sacred Heart School.
Ownership History
Date
Name
Owned For
Owner Type
Purchase Details
Closed on
Sep 7, 2021
Sold by
Ostag Peter and Ostag Elizabeth
Bought by
Burrini Frank
Current Estimated Value
Home Financials for this Owner
Home Financials are based on the most recent Mortgage that was taken out on this home.
Original Mortgage
$360,000
Interest Rate
2.88%
Mortgage Type
New Conventional
Purchase Details
Closed on
Apr 30, 1997
Sold by
Gilmore Robert and Gilmore Nancy
Bought by
Ostag Peter and Ostag Elizabeth
Home Financials for this Owner
Home Financials are based on the most recent Mortgage that was taken out on this home.
Original Mortgage
$100,000
Interest Rate
8.08%
Create a Home Valuation Report for This Property
The Home Valuation Report is an in-depth analysis detailing your home's value as well as a comparison with similar homes in the area
Home Values in the Area
Average Home Value in this Area
Purchase History
| Date | Buyer | Sale Price | Title Company |
|---|---|---|---|
| Burrini Frank | $450,000 | Sage Title & Stlmt Svcs Llc | |
| Ostag Peter | $189,000 | -- |
Source: Public Records
Mortgage History
| Date | Status | Borrower | Loan Amount |
|---|---|---|---|
| Previous Owner | Burrini Frank | $360,000 | |
| Previous Owner | Ostag Peter | $100,000 |
Source: Public Records
Tax History
| Year | Tax Paid | Tax Assessment Tax Assessment Total Assessment is a certain percentage of the fair market value that is determined by local assessors to be the total taxable value of land and additions on the property. | Land | Improvement |
|---|---|---|---|---|
| 2025 | $9,546 | $466,600 | $290,200 | $176,400 |
| 2024 | $9,199 | $457,600 | $283,200 | $174,400 |
| 2023 | $8,146 | $452,700 | $280,200 | $172,500 |
| 2022 | $8,146 | $256,800 | $157,000 | $99,800 |
| 2021 | $7,807 | $256,800 | $157,000 | $99,800 |
| 2020 | $7,637 | $256,800 | $157,000 | $99,800 |
| 2019 | $7,581 | $256,800 | $157,000 | $99,800 |
| 2018 | $7,642 | $256,800 | $157,000 | $99,800 |
| 2017 | $7,450 | $256,800 | $157,000 | $99,800 |
| 2016 | $7,283 | $256,800 | $157,000 | $99,800 |
| 2015 | $7,054 | $256,800 | $157,000 | $99,800 |
| 2014 | $6,962 | $256,800 | $157,000 | $99,800 |
Source: Public Records
Map
Nearby Homes
- 609 Chase Ave
- 471 Harding Ave
- 433 Chase Ave
- 105 Jauncey Ave
- 752 Ridge Rd
- 715 Tyler St
- 1 4th St
- 521 Weart Ave
- 715 Stuyvesant Ave
- 712 Meyer Ave
- 103 Lincoln Ave
- 825 Riverside Ave Unit 204
- 20 Bergen Ave
- 319 Ridge Rd
- 734 Louise Ct
- 230 New St
- 623 Schuyler Ave Unit 302
- 200 Page Ave
- 659 Valley Brook Ave
- 725 Schuyler Ave
Your Personal Tour Guide
Ask me questions while you tour the home.