Estimated Value: $233,896 - $255,000
--
Bed
--
Bath
1,957
Sq Ft
$127/Sq Ft
Est. Value
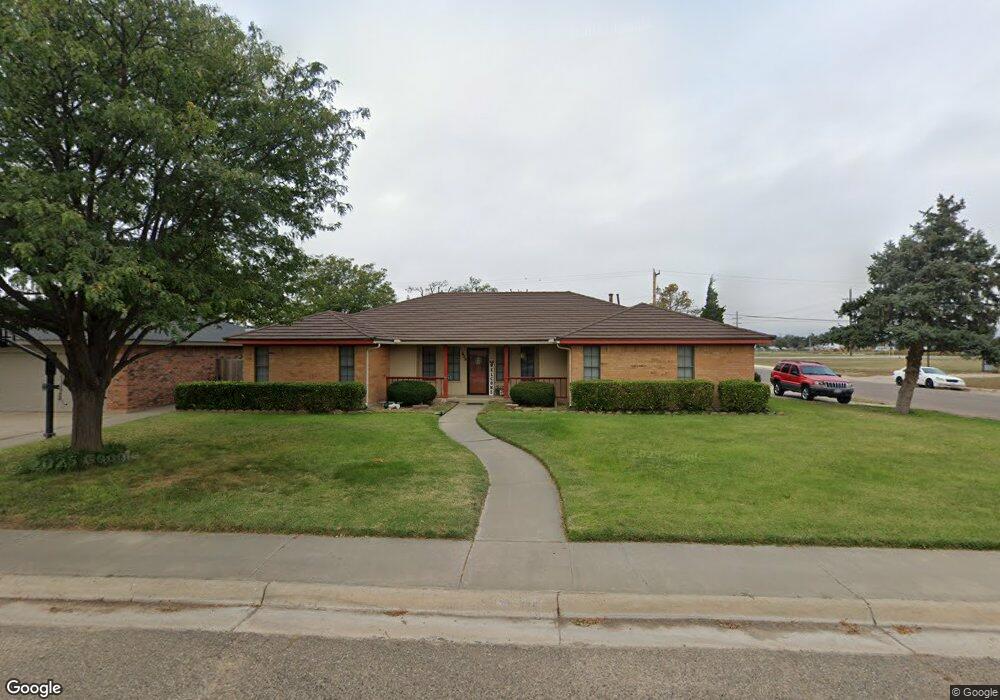
About This Home
This home is located at 629 Belmont Dr, Dumas, TX 79029 and is currently estimated at $248,224, approximately $126 per square foot. 629 Belmont Dr is a home located in Moore County with nearby schools including Dumas High School.
Ownership History
Date
Name
Owned For
Owner Type
Purchase Details
Closed on
Sep 29, 1998
Sold by
Duncan Ardyce B
Bought by
Mcgee Delwin and Mcgee Carrol
Current Estimated Value
Create a Home Valuation Report for This Property
The Home Valuation Report is an in-depth analysis detailing your home's value as well as a comparison with similar homes in the area
Home Values in the Area
Average Home Value in this Area
Purchase History
| Date | Buyer | Sale Price | Title Company |
|---|---|---|---|
| Mcgee Delwin | -- | -- |
Source: Public Records
Tax History Compared to Growth
Tax History
| Year | Tax Paid | Tax Assessment Tax Assessment Total Assessment is a certain percentage of the fair market value that is determined by local assessors to be the total taxable value of land and additions on the property. | Land | Improvement |
|---|---|---|---|---|
| 2024 | $6,186 | $254,990 | $13,060 | $241,930 |
| 2023 | $5,071 | $249,250 | $13,060 | $236,190 |
| 2022 | $5,996 | $239,760 | $13,060 | $226,700 |
| 2021 | $5,132 | $197,080 | $13,060 | $184,020 |
| 2020 | $4,221 | $183,770 | $13,060 | $170,710 |
| 2019 | $4,258 | $183,770 | $13,060 | $170,710 |
| 2018 | $4,185 | $184,110 | $13,060 | $171,050 |
| 2017 | $4,030 | $182,380 | $13,060 | $169,320 |
| 2016 | $3,645 | $170,450 | $14,360 | $156,090 |
| 2015 | -- | $170,450 | $14,360 | $156,090 |
| 2014 | -- | $167,480 | $14,360 | $153,120 |
Source: Public Records
Map
Nearby Homes
- 625 Pear Ave
- 623 Bailey Ave
- 824 Braden
- 515 Belmont Dr
- 801 NE 8th St
- 637 N Maddox Ave
- 629 N Maddox Ave
- 724 Spruce Ave
- 1508 Madison Ave
- 1512 Madison Ave
- 1600 Madison Ave
- 1513 Madison Ave
- 522 Carson Ave
- 921 Norma St
- 510 Bradley Ln
- 402 Carson Ave
- 1800 Madison Ave
- 1045 NE 10th St
- 615 Pine Ave
- 406 Bradley Ln
- 627 Belmont Dr
- 1301 Bailey Ave
- 625 Belmont Dr
- 1207 Bailey Ave
- 1209 Bailey Ave
- 628 Belmont Dr
- 624 Belmont Dr
- 1305 Bailey Ave
- 1303 Bailey Ave
- 623 Belmont Dr
- 622 Belmont Dr
- 621 Belmont Dr
- 629 Forrest Dr
- 627 Forrest Dr
- 1307 Bailey Ave
- 620 Belmont Dr
- 625 Forrest Dr
- 619 Belmont Dr
- 1309 Bailey Ave
- 618 Belmont Dr