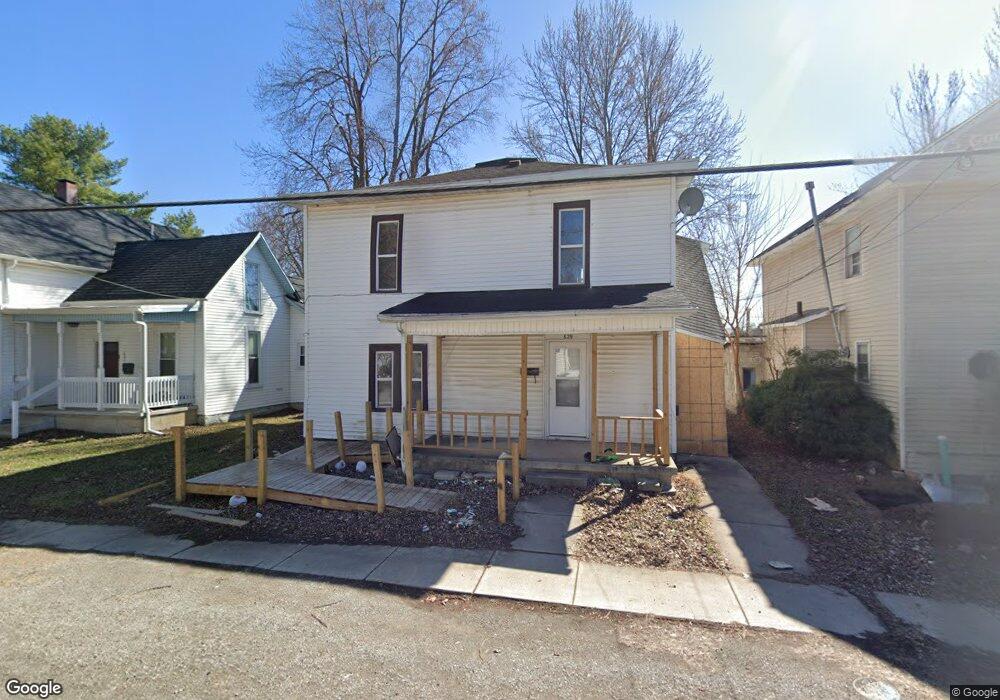
629 Bennett St Findlay, OH 45840
Estimated Value: $66,000 - $128,304
4
Beds
2
Baths
2,020
Sq Ft
$43/Sq Ft
Est. Value
About This Home
This home is located at 629 Bennett St, Findlay, OH 45840 and is currently estimated at $86,576, approximately $42 per square foot. 629 Bennett St is a home located in Hancock County with nearby schools including Whittier Elementary School, Wilson Vance Elementary School, and Donnell Middle School.
Ownership History
Date
Name
Owned For
Owner Type
Purchase Details
Closed on
Apr 16, 2025
Sold by
Cunningham & Yates Ltd
Bought by
Veezy Investment Properties Llc
Current Estimated Value
Home Financials for this Owner
Home Financials are based on the most recent Mortgage that was taken out on this home.
Original Mortgage
$81,260
Outstanding Balance
$36,613
Interest Rate
6.63%
Mortgage Type
Construction
Estimated Equity
$49,963
Purchase Details
Closed on
Feb 14, 2020
Sold by
Yates Aleta J and Cunningham Russell E
Bought by
Cunningham & Yates Ltd
Purchase Details
Closed on
Sep 18, 1991
Bought by
Yates Aleta J
Purchase Details
Closed on
Jan 25, 1991
Bought by
Smith John F and Smith Betty M
Create a Home Valuation Report for This Property
The Home Valuation Report is an in-depth analysis detailing your home's value as well as a comparison with similar homes in the area
Home Values in the Area
Average Home Value in this Area
Purchase History
| Date | Buyer | Sale Price | Title Company |
|---|---|---|---|
| Veezy Investment Properties Llc | $65,000 | None Listed On Document | |
| Veezy Investment Properties Llc | $65,000 | None Listed On Document | |
| Cunningham & Yates Ltd | -- | None Available | |
| Yates Aleta J | $25,500 | -- | |
| Smith John F | $5,000 | -- |
Source: Public Records
Mortgage History
| Date | Status | Borrower | Loan Amount |
|---|---|---|---|
| Open | Veezy Investment Properties Llc | $81,260 | |
| Closed | Veezy Investment Properties Llc | $81,260 |
Source: Public Records
Tax History
| Year | Tax Paid | Tax Assessment Tax Assessment Total Assessment is a certain percentage of the fair market value that is determined by local assessors to be the total taxable value of land and additions on the property. | Land | Improvement |
|---|---|---|---|---|
| 2024 | $981 | $26,910 | $3,960 | $22,950 |
| 2023 | $983 | $26,910 | $3,960 | $22,950 |
| 2022 | $979 | $26,910 | $3,960 | $22,950 |
| 2021 | $737 | $17,640 | $3,950 | $13,690 |
| 2020 | $737 | $17,640 | $3,950 | $13,690 |
| 2019 | $722 | $17,640 | $3,950 | $13,690 |
| 2018 | $632 | $14,120 | $3,590 | $10,530 |
| 2017 | $315 | $14,120 | $3,590 | $10,530 |
| 2016 | $635 | $14,120 | $3,590 | $10,530 |
| 2015 | $671 | $14,920 | $3,590 | $11,330 |
| 2014 | $671 | $14,920 | $3,590 | $11,330 |
| 2012 | $864 | $19,010 | $3,590 | $15,420 |
Source: Public Records
Map
Nearby Homes
- 15591 Canadian Way
- 15586 Canadian Way
- 15615 Canadian Way
- 829 Maple Ave
- 216 1st St
- 1037 Fishlock Ave
- 731 5th St
- 865 S Main St
- 1100 Stall Dr
- 1001 Decker Ave
- 1200 1st St
- 206 Greenlawn Ave
- 309 Huron Rd
- 123 Glendale Ave
- 0 Blanchard Ave
- 1421 E Sandusky St
- 523 Center St
- 1421 Autumn Dr
- 640 Center St
- 1304 Douglas Pkwy
Your Personal Tour Guide
Ask me questions while you tour the home.