J
Landlord's Agent in 2022
Jayesh Parekh
Kale Realty
(847) 962-0239
72 Total Sales
Estimated Value: $256,167 - $314,000
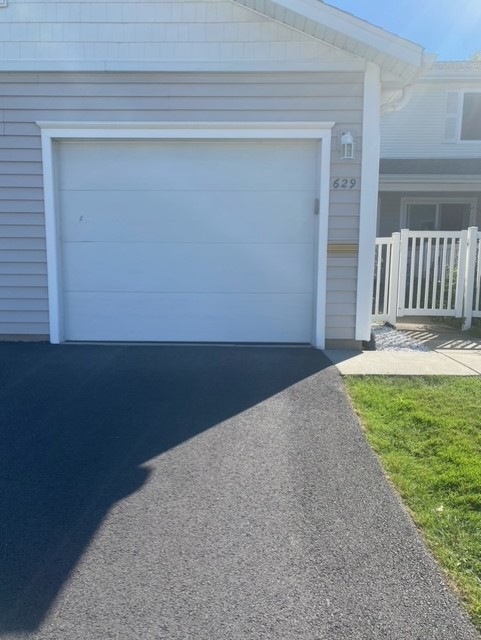
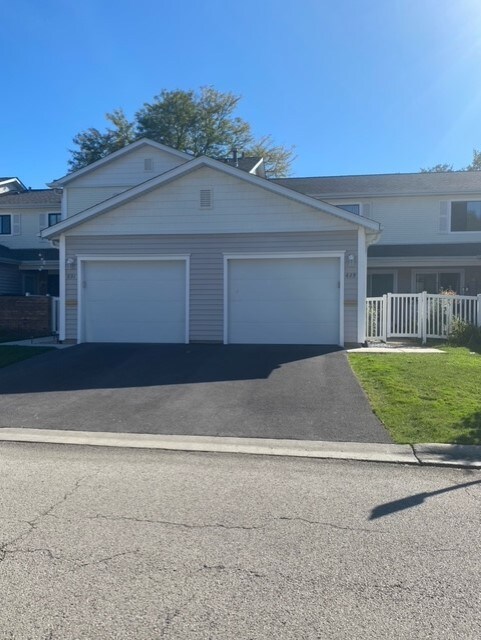
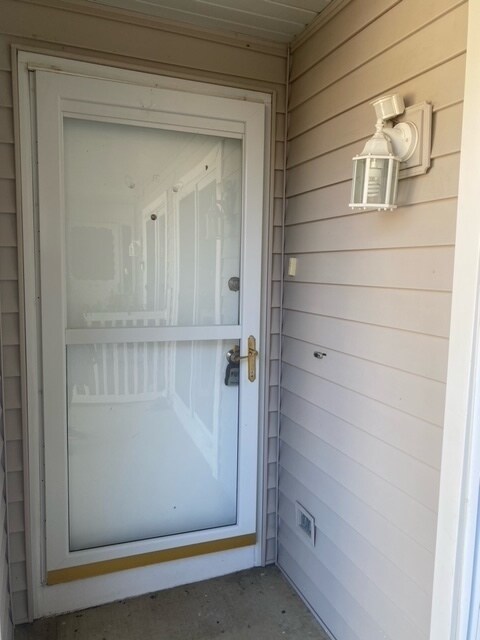
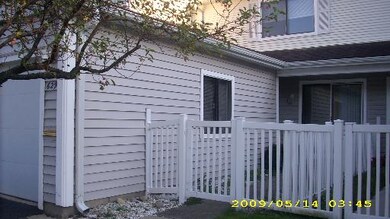
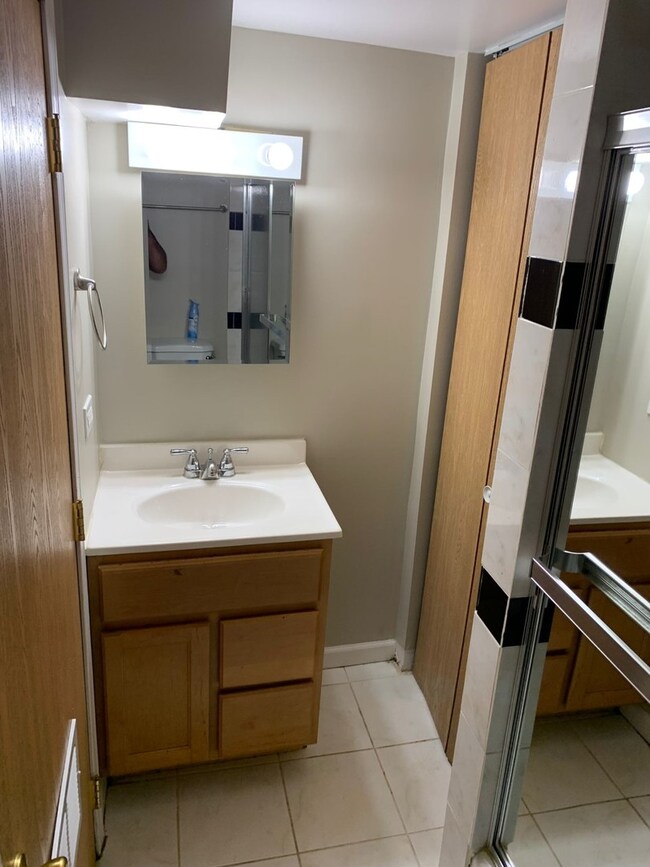
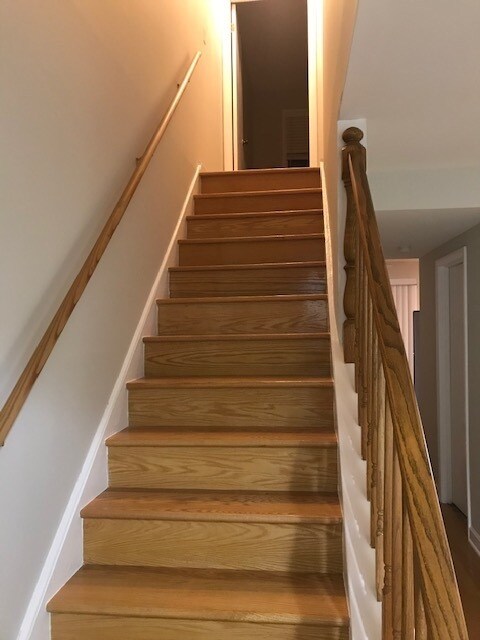
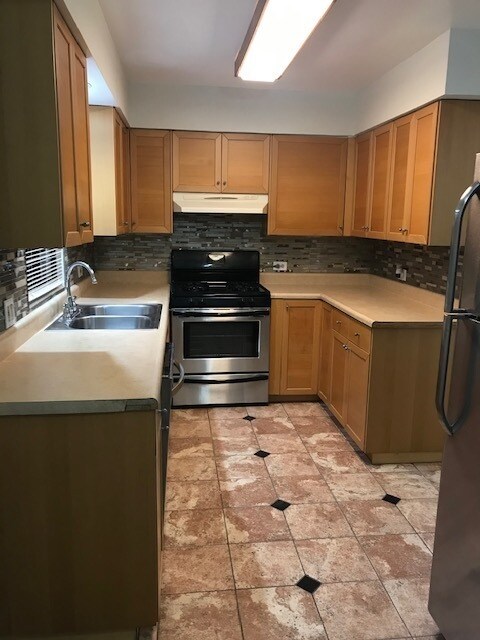
Fantastic buy and great location2 bed 2.5 bath with full basement Allison model and one car garage Oak Hardwood floors update appliances finish basement with bathroom. New Patio door updated kitchen washer and dryer is 3 year old close to highway
| Date | Buyer | Sale Price | Title Company |
|---|---|---|---|
| Karunagaran Ramani | -- | None Available | |
| Karunagaran Ramani | $146,000 | None Available | |
| Udupi Palace Inc | $169,000 | Cti |
| Date | Status | Borrower | Loan Amount |
|---|---|---|---|
| Open | Karunagaran Ramani | $116,800 |
| Date | Event | Price | List to Sale | Price per Sq Ft |
|---|---|---|---|---|
| 01/26/2022 01/26/22 | Rented | -- | -- | -- |
| 12/13/2021 12/13/21 | Under Contract | -- | -- | -- |
| 11/28/2021 11/28/21 | For Rent | $1,800 | -- | -- |
| Year | Tax Paid | Tax Assessment Tax Assessment Total Assessment is a certain percentage of the fair market value that is determined by local assessors to be the total taxable value of land and additions on the property. | Land | Improvement |
|---|---|---|---|---|
| 2025 | $4,674 | $25,604 | $3,343 | $22,261 |
| 2024 | $4,674 | $16,686 | $3,566 | $13,120 |
| 2023 | $3,603 | $16,686 | $3,566 | $13,120 |
| 2022 | $3,603 | $16,686 | $3,566 | $13,120 |
| 2021 | $3,387 | $14,504 | $4,568 | $9,936 |
| 2020 | $3,396 | $14,504 | $4,568 | $9,936 |
| 2019 | $3,403 | $16,124 | $4,568 | $11,556 |
| 2018 | $3,111 | $13,803 | $3,844 | $9,959 |
| 2017 | $3,080 | $13,803 | $3,844 | $9,959 |
| 2016 | $3,612 | $15,573 | $3,844 | $11,729 |
| 2015 | $2,236 | $10,098 | $3,342 | $6,756 |
| 2014 | $2,228 | $10,098 | $3,342 | $6,756 |
| 2013 | $2,645 | $10,898 | $3,342 | $7,556 |
J
Landlord's Agent in 2022
Jayesh Parekh
Kale Realty
(847) 962-0239
72 Total Sales

Tenant's Agent in 2022
Anna Iovenko
KOMAR
(312) 478-1300
19 Total Sales
Source: Midwest Real Estate Data (MRED)
MLS Number: 11277325
APN: 07-23-103-010-1003
Disclaimer: Certain information contained herein is derived from information provided by parties other than Homes.com. All information provided is deemed reliable, but is not guaranteed to be accurate and should be independently verified.
![]() Based on information submitted to the MLS GRID. All data is obtained from various sources and may not have been verified by broker or MLS GRID. Supplied Open House Information is subject to change without notice. All information should be independently reviewed and verified for accuracy. Properties may or may not be listed by the office/agent presenting the information. Some IDX listings have been excluded from this website.
Based on information submitted to the MLS GRID. All data is obtained from various sources and may not have been verified by broker or MLS GRID. Supplied Open House Information is subject to change without notice. All information should be independently reviewed and verified for accuracy. Properties may or may not be listed by the office/agent presenting the information. Some IDX listings have been excluded from this website.
Based on information submitted to the MLS GRID
Ask me questions while you tour the home.