629 Byars Dr Macon, GA 31210
Estimated Value: $553,000 - $972,896
4
Beds
5
Baths
4,683
Sq Ft
$165/Sq Ft
Est. Value
About This Home
This home is located at 629 Byars Dr, Macon, GA 31210 and is currently estimated at $770,965, approximately $164 per square foot. 629 Byars Dr is a home located in Monroe County with nearby schools including T.G. Scott Elementary School, Mary Persons High School, and St. Andrews Montessori School.
Ownership History
Date
Name
Owned For
Owner Type
Purchase Details
Closed on
Mar 23, 2018
Sold by
Jones Julia E
Bought by
Sims Molly R and Sims Jesse C
Current Estimated Value
Home Financials for this Owner
Home Financials are based on the most recent Mortgage that was taken out on this home.
Original Mortgage
$453,100
Outstanding Balance
$387,610
Interest Rate
4.4%
Mortgage Type
New Conventional
Estimated Equity
$383,356
Purchase Details
Closed on
Sep 15, 1978
Sold by
Sally A Caldwell
Bought by
Jones Julia E
Create a Home Valuation Report for This Property
The Home Valuation Report is an in-depth analysis detailing your home's value as well as a comparison with similar homes in the area
Home Values in the Area
Average Home Value in this Area
Purchase History
| Date | Buyer | Sale Price | Title Company |
|---|---|---|---|
| Sims Molly R | $703,000 | None Available | |
| Jones Julia E | $175,000 | -- |
Source: Public Records
Mortgage History
| Date | Status | Borrower | Loan Amount |
|---|---|---|---|
| Open | Sims Molly R | $453,100 |
Source: Public Records
Tax History Compared to Growth
Tax History
| Year | Tax Paid | Tax Assessment Tax Assessment Total Assessment is a certain percentage of the fair market value that is determined by local assessors to be the total taxable value of land and additions on the property. | Land | Improvement |
|---|---|---|---|---|
| 2025 | $6,969 | $290,608 | $69,760 | $220,848 |
| 2024 | $6,169 | $249,890 | $29,042 | $220,848 |
| 2023 | $5,712 | $249,890 | $29,042 | $220,848 |
| 2022 | $8,381 | $249,086 | $75,704 | $173,382 |
| 2021 | $9,199 | $249,086 | $75,704 | $173,382 |
| 2020 | $9,399 | $249,086 | $75,704 | $173,382 |
| 2019 | $9,413 | $249,086 | $75,704 | $173,382 |
| 2018 | $11,673 | $198,719 | $68,822 | $129,897 |
| 2017 | $7,183 | $198,719 | $68,822 | $129,897 |
| 2016 | $6,633 | $198,718 | $68,822 | $129,897 |
| 2015 | $9,262 | $196,128 | $68,822 | $127,306 |
| 2014 | $3,092 | $196,128 | $68,822 | $127,306 |
Source: Public Records
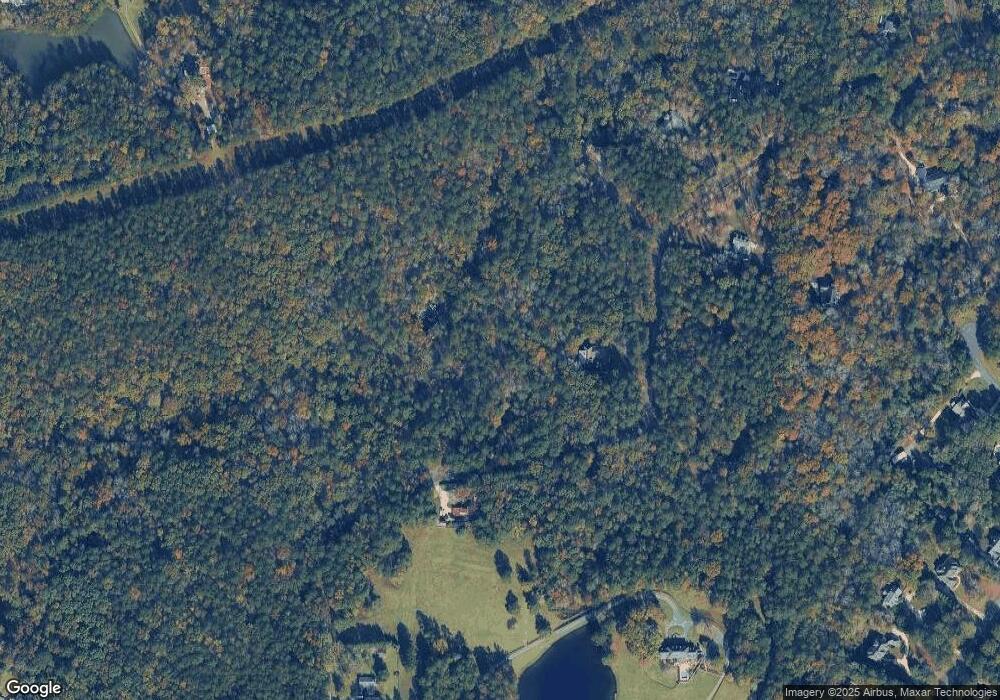
Map
Nearby Homes