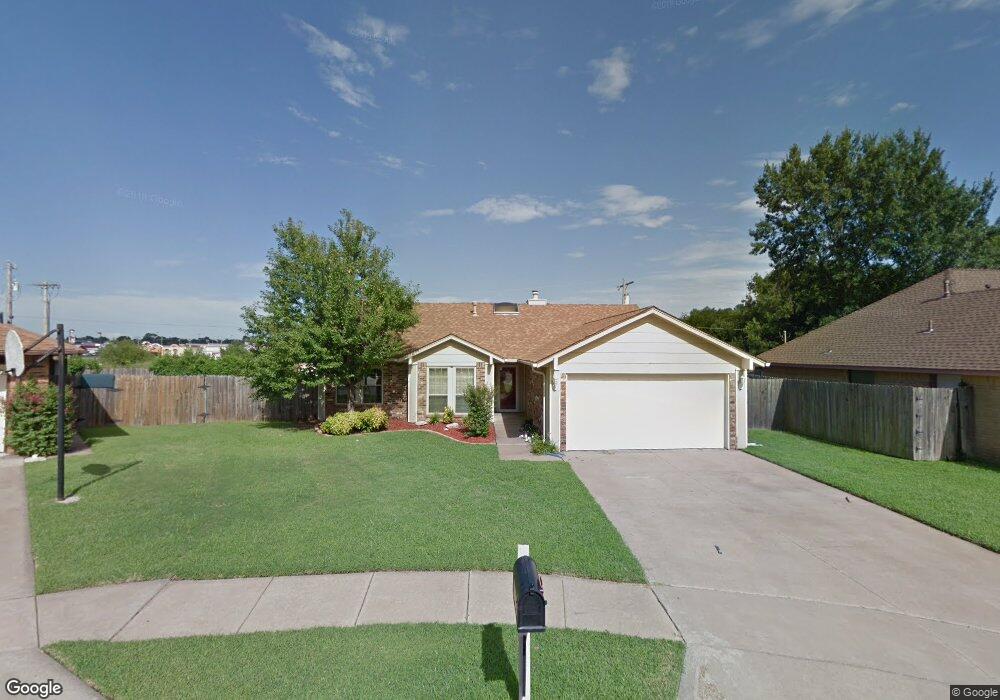
629 Greenbriar Rd Ponca City, OK 74601
Estimated Value: $152,000 - $193,000
3
Beds
2
Baths
1,516
Sq Ft
$113/Sq Ft
Est. Value
About This Home
This home is located at 629 Greenbriar Rd, Ponca City, OK 74601 and is currently estimated at $171,893, approximately $113 per square foot. 629 Greenbriar Rd is a home located in Kay County with nearby schools including E.M. Trout Elementary School, Ponca City East Middle School, and Ponca City West Middle School.
Ownership History
Date
Name
Owned For
Owner Type
Purchase Details
Closed on
Nov 20, 2009
Sold by
Dsb Renovations Llp
Bought by
Lowe Carla G
Current Estimated Value
Home Financials for this Owner
Home Financials are based on the most recent Mortgage that was taken out on this home.
Original Mortgage
$96,000
Outstanding Balance
$62,137
Interest Rate
4.83%
Mortgage Type
New Conventional
Estimated Equity
$109,756
Purchase Details
Closed on
Aug 17, 2009
Sold by
Huber Colleen F
Bought by
Dsb Renovations Llp
Purchase Details
Closed on
Feb 23, 2006
Sold by
Burch Weslley D and Burch Kellie R
Bought by
Huber Colleen F
Purchase Details
Closed on
Dec 31, 1996
Sold by
Michael K Rich
Bought by
Wesley D Burch
Purchase Details
Closed on
Apr 27, 1995
Sold by
Gary Bracken
Bought by
Don Bouldin Inc
Purchase Details
Closed on
Dec 16, 1994
Sold by
Gary Bracken
Bought by
Don Bo 00110-Nc
Create a Home Valuation Report for This Property
The Home Valuation Report is an in-depth analysis detailing your home's value as well as a comparison with similar homes in the area
Home Values in the Area
Average Home Value in this Area
Purchase History
| Date | Buyer | Sale Price | Title Company |
|---|---|---|---|
| Lowe Carla G | $120,000 | -- | |
| Dsb Renovations Llp | -- | -- | |
| Dsb Renovations Llp | $125,000 | -- | |
| Huber Colleen F | $115,000 | -- | |
| Wesley D Burch | $73,000 | -- | |
| Don Bouldin Inc | $73,300 | -- | |
| Don Bo 00110-Nc | $71,500 | -- |
Source: Public Records
Mortgage History
| Date | Status | Borrower | Loan Amount |
|---|---|---|---|
| Open | Lowe Carla G | $96,000 |
Source: Public Records
Tax History Compared to Growth
Tax History
| Year | Tax Paid | Tax Assessment Tax Assessment Total Assessment is a certain percentage of the fair market value that is determined by local assessors to be the total taxable value of land and additions on the property. | Land | Improvement |
|---|---|---|---|---|
| 2024 | $1,221 | $13,895 | $1,450 | $12,445 |
| 2023 | $1,221 | $13,490 | $1,450 | $12,040 |
| 2022 | $1,151 | $13,097 | $1,450 | $11,647 |
| 2021 | $1,157 | $13,097 | $1,450 | $11,647 |
| 2020 | $1,132 | $12,961 | $1,450 | $11,511 |
| 2019 | $1,107 | $12,584 | $1,450 | $11,134 |
| 2018 | $1,145 | $12,822 | $1,450 | $11,372 |
| 2017 | $1,175 | $12,992 | $1,450 | $11,542 |
| 2016 | $1,221 | $13,331 | $1,450 | $11,881 |
| 2015 | $1,231 | $13,375 | $1,450 | $11,925 |
| 2014 | $1,173 | $13,015 | $1,450 | $11,565 |
Source: Public Records
Map
Nearby Homes
- TBD 5th and Windsor
- 1413 Crawford Ave
- 2612 Meadow Ln
- 120 E Woodbury Rd
- 3019 Meadow Ln
- 1704 Fairway Place
- 3651 N 14th St
- 1703 Leslie Ln
- 3013 Kingston Rd
- 3205 Kingston Rd
- 3602 N 14th
- 2000 N 5th St
- 2005 N 4th St
- 0000 N Union St
- 2117 Ashley Place
- 2223 Turner St
- 1128 N 14th St
- 2216 El Camino St
- 2208 El Camino St
- 113 E Fresno Ave
- 701 Greenbriar Rd
- 625 Greenbriar Rd
- 705 Greenbriar Rd
- 621 Greenbriar Rd
- 709 Greenbriar Rd
- 617 Greenbriar Rd
- 616 Greenbriar Rd
- 713 Greenbriar Rd
- 613 Greenbriar Rd
- 617 Shamrock Cir
- 608 Greenbriar Rd
- 609 Greenbriar Rd
- 613 Shamrock Cir
- 717 Greenbriar Rd
- 609 Shamrock Cir
- 604 Greenbriar Rd
- 605 Greenbriar Rd
- 801 Greenbriar Rd
- 605 Shamrock Cir
- 600 Greenbriar Rd