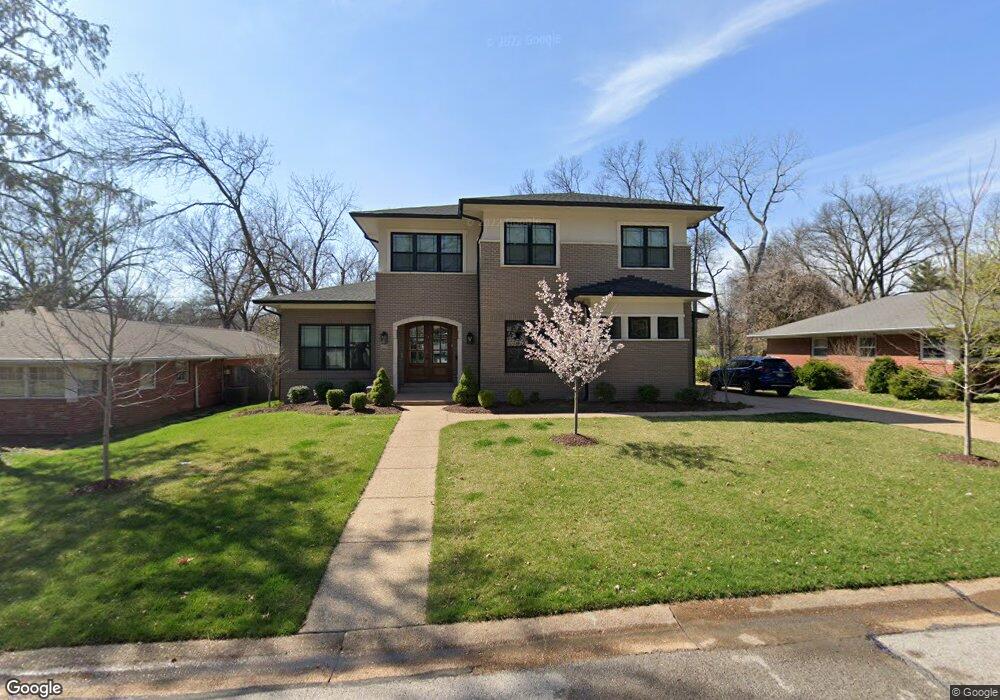
629 Langton Dr Saint Louis, MO 63105
Downtown Clayton NeighborhoodEstimated Value: $555,000 - $1,470,562
3
Beds
2
Baths
1,800
Sq Ft
$627/Sq Ft
Est. Value
About This Home
This home is located at 629 Langton Dr, Saint Louis, MO 63105 and is currently estimated at $1,128,391, approximately $626 per square foot. 629 Langton Dr is a home located in St. Louis County with nearby schools including Meramec Elementary, Wydown Middle School, and Clayton High School.
Ownership History
Date
Name
Owned For
Owner Type
Purchase Details
Closed on
Oct 20, 2017
Sold by
Rathikindl Venkatasreedhar and Mungara Kiranmayl
Bought by
Rathikindi Venkatasreedhar and Mungara Kiranmayi
Current Estimated Value
Home Financials for this Owner
Home Financials are based on the most recent Mortgage that was taken out on this home.
Original Mortgage
$668,000
Interest Rate
3.78%
Mortgage Type
Future Advance Clause Open End Mortgage
Purchase Details
Closed on
Jul 7, 2016
Sold by
Patel Ankur B and Patel Priya A
Bought by
Rathikindi Venkatasreedhar and Mungara Kiranmayi
Home Financials for this Owner
Home Financials are based on the most recent Mortgage that was taken out on this home.
Original Mortgage
$330,750
Interest Rate
3.62%
Mortgage Type
Adjustable Rate Mortgage/ARM
Purchase Details
Closed on
May 24, 2011
Sold by
Furla Margaret E
Bought by
Patel Ankur B and Patel Priya A
Purchase Details
Closed on
Mar 2, 2011
Sold by
Furla Margaret E
Bought by
Furla Margaret E
Create a Home Valuation Report for This Property
The Home Valuation Report is an in-depth analysis detailing your home's value as well as a comparison with similar homes in the area
Home Values in the Area
Average Home Value in this Area
Purchase History
| Date | Buyer | Sale Price | Title Company |
|---|---|---|---|
| Rathikindi Venkatasreedhar | -- | Hillsboro Title Company | |
| Rathikindi Venkatasreedhar | -- | Touchstone Title & Abstract | |
| Patel Ankur B | $253,000 | None Available | |
| Furla Margaret E | -- | None Available |
Source: Public Records
Mortgage History
| Date | Status | Borrower | Loan Amount |
|---|---|---|---|
| Closed | Rathikindi Venkatasreedhar | $668,000 | |
| Closed | Rathikindi Venkatasreedhar | $330,750 |
Source: Public Records
Tax History Compared to Growth
Tax History
| Year | Tax Paid | Tax Assessment Tax Assessment Total Assessment is a certain percentage of the fair market value that is determined by local assessors to be the total taxable value of land and additions on the property. | Land | Improvement |
|---|---|---|---|---|
| 2025 | $16,398 | $214,740 | $57,000 | $157,740 |
| 2024 | $16,398 | $241,220 | $42,750 | $198,470 |
| 2023 | $16,380 | $241,220 | $42,750 | $198,470 |
| 2022 | $15,155 | $211,100 | $48,740 | $162,360 |
| 2021 | $15,101 | $211,100 | $48,740 | $162,360 |
| 2020 | $12,977 | $175,670 | $52,250 | $123,420 |
| 2019 | $12,803 | $175,670 | $52,250 | $123,420 |
| 2018 | $4,600 | $63,970 | $38,000 | $25,970 |
| 2017 | $4,569 | $63,970 | $38,000 | $25,970 |
| 2016 | $4,062 | $54,130 | $26,600 | $27,530 |
| 2015 | $4,098 | $54,130 | $26,600 | $27,530 |
| 2014 | $3,787 | $48,020 | $20,240 | $27,780 |
Source: Public Records
Map
Nearby Homes
- 8111 Roxburgh Dr Unit 1NE
- 8111 Roxburgh Dr Unit 1SE
- 8166 Whitburn Dr
- 8140 Whitburn Dr
- 250 S Brentwood Blvd Unit 1H
- 10 Brighton Way Unit 1
- 200 S Brentwood Blvd Unit 7E
- 200 S Brentwood Blvd Unit 14D
- 4 Ridgewood St
- 8250 Forsyth Blvd Unit 109
- 8250 Forsyth Blvd Unit 303
- 8250 Forsyth Blvd Unit 402
- 8250 Forsyth Blvd Unit 408
- 8250 Forsyth Blvd Unit 405
- 8250 Forsyth Blvd Unit 210
- 8250 Forsyth Blvd Unit 103
- 8250 Forsyth Blvd Unit 404
- 8250 Forsyth Blvd Unit 105
- 8250 Forsyth Blvd Unit 208
- 8250 Forsyth Blvd Unit 401
- 633 Langton Dr
- 625 Langton Dr
- 639 Langton Dr
- 615 Langton Dr
- 726 Wenneker Dr
- 734 Wenneker Dr
- 621 Francis Place
- 630 Langton Dr
- 718 Wenneker Dr
- 742 Wenneker Dr
- 607 Langton Dr
- 645 Langton Dr
- 631 Francis Place
- 640 Langton Dr
- 630 Francis Place Unit 2S
- 630 Francis Place Unit 1N
- 630 Francis Place Unit 2N
- 630 Francis Place Unit 1South
- 712 Wenneker Dr
- 750 Wenneker Dr