T
Landlord's Agent in 2023
Tanika Tanika Ford
Progress Residential Property Manager, LLC.
Estimated Value: $353,000 - $384,000
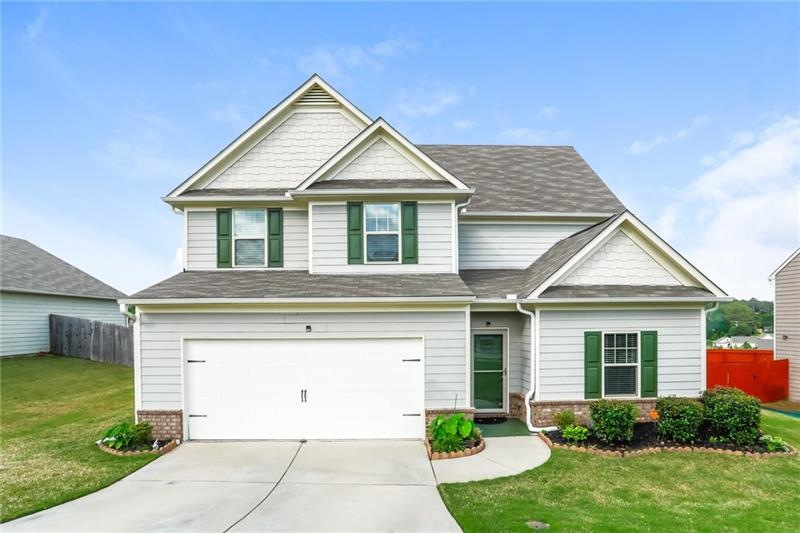
You can rent this house in Winder with an expansive, fenced-in backyard. Vinyl plank flooring runs throughout the rental home, making it feel modern and stylish. In the living room, the large windows bring in natural light. The dining room has a glass door through which you can access the patio and yard, giving you a nice view while you enjoy your meals. Home cooks will appreciate the long granite countertops in the kitchen, as well as the modern appliances and center island. A walk-in pantry provides plenty of storage space. In the main bedroom, the en suite bathroom treats you to a beautiful vanity, tub, and walk-in shower.
Last Agent to Rent the Property
Tanika Tanika Ford
Progress Residential Property Manager, LLC. License #334101 Listed on: 06/15/2021
Last Renter's Agent
Tanika Tanika Ford
Progress Residential Property Manager, LLC. License #334101 Listed on: 06/15/2021
| Date | Event | Price | List to Sale | Price per Sq Ft | Prior Sale |
|---|---|---|---|---|---|
| 10/05/2023 10/05/23 | Rented | $2,180 | +0.2% | -- | |
| 09/25/2023 09/25/23 | Under Contract | -- | -- | -- | |
| 09/22/2023 09/22/23 | Price Changed | $2,175 | -0.2% | $1 / Sq Ft | |
| 09/22/2023 09/22/23 | For Rent | $2,180 | 0.0% | -- | |
| 09/21/2023 09/21/23 | Under Contract | -- | -- | -- | |
| 09/20/2023 09/20/23 | For Rent | $2,180 | 0.0% | -- | |
| 09/20/2023 09/20/23 | Price Changed | $2,180 | +0.7% | $1 / Sq Ft | |
| 09/11/2023 09/11/23 | Under Contract | -- | -- | -- | |
| 09/11/2023 09/11/23 | For Rent | $2,165 | 0.0% | -- | |
| 09/08/2023 09/08/23 | Under Contract | -- | -- | -- | |
| 09/06/2023 09/06/23 | Price Changed | $2,165 | -0.2% | $1 / Sq Ft | |
| 09/05/2023 09/05/23 | Price Changed | $2,170 | +0.2% | $1 / Sq Ft | |
| 08/31/2023 08/31/23 | Price Changed | $2,165 | +0.2% | $1 / Sq Ft | |
| 08/30/2023 08/30/23 | Price Changed | $2,160 | -2.5% | $1 / Sq Ft | |
| 08/22/2023 08/22/23 | Price Changed | $2,215 | -4.3% | $1 / Sq Ft | |
| 08/18/2023 08/18/23 | For Rent | $2,315 | +2.4% | -- | |
| 08/01/2022 08/01/22 | Rented | $2,260 | 0.0% | -- | |
| 07/25/2022 07/25/22 | Under Contract | -- | -- | -- | |
| 07/21/2022 07/21/22 | For Rent | $2,260 | +3.0% | -- | |
| 07/13/2021 07/13/21 | Rented | $2,195 | 0.0% | -- | |
| 06/28/2021 06/28/21 | Under Contract | -- | -- | -- | |
| 06/23/2021 06/23/21 | Price Changed | $2,195 | -2.7% | $1 / Sq Ft | |
| 06/19/2021 06/19/21 | Price Changed | $2,255 | +0.4% | $1 / Sq Ft | |
| 06/17/2021 06/17/21 | Price Changed | $2,245 | +2.0% | $1 / Sq Ft | |
| 06/15/2021 06/15/21 | For Rent | $2,200 | 0.0% | -- | |
| 05/14/2021 05/14/21 | Sold | $295,000 | +2.2% | $129 / Sq Ft | View Prior Sale |
| 04/23/2021 04/23/21 | Pending | -- | -- | -- | |
| 04/21/2021 04/21/21 | For Sale | $288,750 | -- | $127 / Sq Ft |
| Year | Tax Paid | Tax Assessment Tax Assessment Total Assessment is a certain percentage of the fair market value that is determined by local assessors to be the total taxable value of land and additions on the property. | Land | Improvement |
|---|---|---|---|---|
| 2024 | $3,660 | $130,092 | $25,600 | $104,492 |
| 2023 | $3,649 | $130,092 | $25,600 | $104,492 |
| 2022 | $3,472 | $103,841 | $20,400 | $83,441 |
| 2021 | $3,016 | $89,615 | $16,000 | $73,615 |
| 2020 | $2,707 | $83,248 | $16,000 | $67,248 |
| 2019 | $2,639 | $80,065 | $16,000 | $64,065 |
| 2018 | $2,554 | $77,776 | $16,000 | $61,776 |
| 2017 | $2,074 | $69,500 | $16,000 | $53,500 |
| 2016 | $2,215 | $70,137 | $16,000 | $54,137 |
| 2015 | $368 | $9,600 | $9,600 | $0 |
| 2014 | $195 | $4,368 | $4,368 | $0 |
| 2013 | -- | $1,965 | $1,965 | $0 |
T
Landlord's Agent in 2023
Tanika Tanika Ford
Progress Residential Property Manager, LLC.

Seller's Agent in 2021
Louise Bannister
CKE Realty Services, LLC.
(678) 858-1180
3 in this area
94 Total Sales
Buyer's Agent in 2021
Michelle Sanders
Sanders RE, LLC
(678) 888-3438
5 in this area
300 Total Sales
Source: First Multiple Listing Service (FMLS)
MLS Number: 6899686
APN: WN23A-113
Disclaimer: Certain information contained herein is derived from information provided by parties other than Homes.com. All information provided is deemed reliable, but is not guaranteed to be accurate and should be independently verified.
![]() Listings identified with the FMLS IDX logo come from FMLS and are held by brokerage firms other than the owner of this website. The listing brokerage is identified in any listing details. Information is deemed reliable but is not guaranteed. If you believe any FMLS listing contains material that infringes your copyrighted work please visit www.fmls.com/dmca to review our DMCA policy and learn how to submit a takedown request. © 2025 First Multiple Listing Service, Inc.
Listings identified with the FMLS IDX logo come from FMLS and are held by brokerage firms other than the owner of this website. The listing brokerage is identified in any listing details. Information is deemed reliable but is not guaranteed. If you believe any FMLS listing contains material that infringes your copyrighted work please visit www.fmls.com/dmca to review our DMCA policy and learn how to submit a takedown request. © 2025 First Multiple Listing Service, Inc.