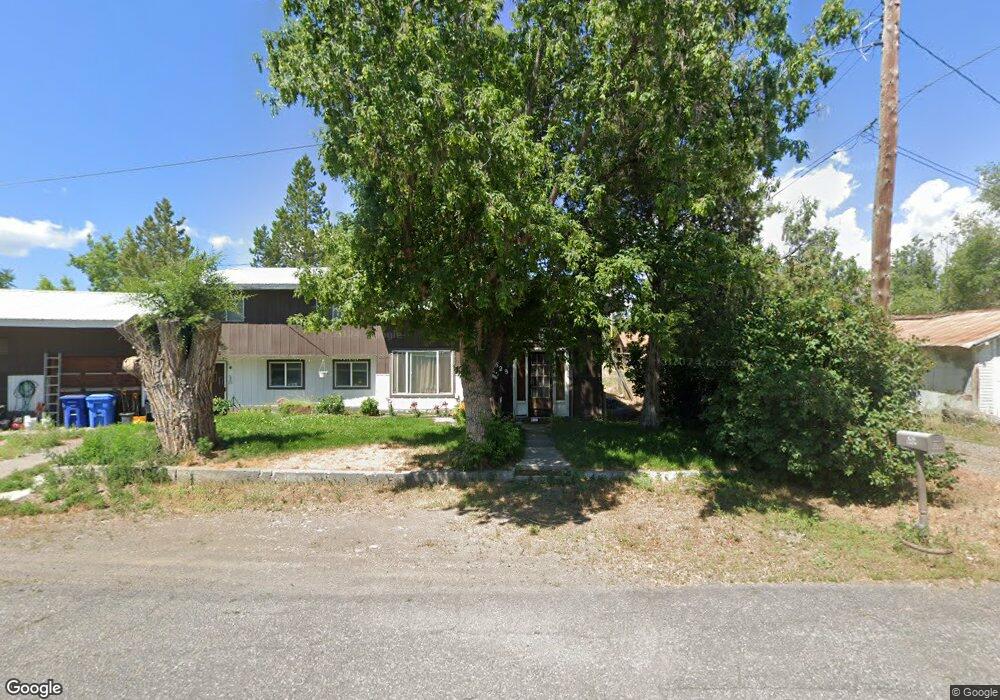
629 S 2nd W Saint Anthony, ID 83445
Estimated Value: $259,000 - $308,000
5
Beds
2
Baths
1,684
Sq Ft
$174/Sq Ft
Est. Value
About This Home
This home is located at 629 S 2nd W, Saint Anthony, ID 83445 and is currently estimated at $292,819, approximately $173 per square foot. 629 S 2nd W is a home located in Fremont County with nearby schools including Henrys Fork Elementary School, South Fremont Junior High School, and South Fremont High School.
Ownership History
Date
Name
Owned For
Owner Type
Purchase Details
Closed on
Dec 12, 2017
Sold by
Larson Brad D
Bought by
Larson Brady D and Larson Bard D
Current Estimated Value
Purchase Details
Closed on
Dec 9, 2016
Sold by
Larson Stucki Dianne
Bought by
Larson Brad D
Create a Home Valuation Report for This Property
The Home Valuation Report is an in-depth analysis detailing your home's value as well as a comparison with similar homes in the area
Home Values in the Area
Average Home Value in this Area
Purchase History
| Date | Buyer | Sale Price | Title Company |
|---|---|---|---|
| Larson Brady D | -- | None Available | |
| Larson Brad D | -- | None Available |
Source: Public Records
Tax History Compared to Growth
Tax History
| Year | Tax Paid | Tax Assessment Tax Assessment Total Assessment is a certain percentage of the fair market value that is determined by local assessors to be the total taxable value of land and additions on the property. | Land | Improvement |
|---|---|---|---|---|
| 2025 | $1,045 | $123,012 | $34,739 | $88,273 |
| 2024 | $1,045 | $120,555 | $34,739 | $85,816 |
| 2023 | $995 | $120,555 | $34,739 | $85,816 |
| 2022 | $1,321 | $100,900 | $34,739 | $66,161 |
| 2021 | $1,308 | $78,756 | $18,949 | $59,807 |
| 2020 | $1,330 | $74,825 | $18,949 | $55,876 |
| 2019 | $1,235 | $74,825 | $18,949 | $55,876 |
| 2018 | $1,260 | $66,472 | $18,949 | $47,523 |
| 2017 | $22 | $109,775 | $18,381 | $91,394 |
| 2016 | $939 | $54,887 | $18,381 | $36,506 |
| 2015 | $923 | $109,775 | $0 | $0 |
| 2014 | $851 | $54,887 | $0 | $0 |
| 2013 | $851 | $54,887 | $0 | $0 |
Source: Public Records
Map
Nearby Homes