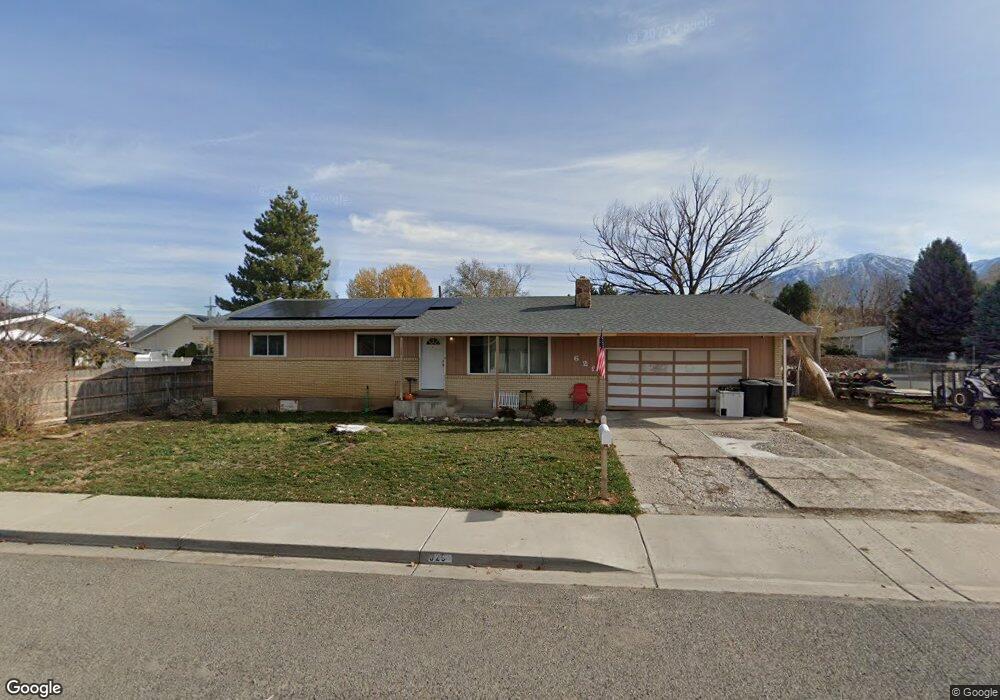
629 S 700 W Payson, UT 84651
Estimated Value: $455,000 - $506,000
4
Beds
2
Baths
2,610
Sq Ft
$186/Sq Ft
Est. Value
About This Home
This home is located at 629 S 700 W, Payson, UT 84651 and is currently estimated at $484,429, approximately $185 per square foot. 629 S 700 W is a home located in Utah County with nearby schools including Wilson Elementary School, Mt. Nebo Middle, and Payson Junior High School.
Ownership History
Date
Name
Owned For
Owner Type
Purchase Details
Closed on
Sep 19, 2019
Sold by
Forsyth Rees and Estate Of Marilyn Collings
Bought by
Barnes Timothy T
Current Estimated Value
Home Financials for this Owner
Home Financials are based on the most recent Mortgage that was taken out on this home.
Original Mortgage
$261,900
Outstanding Balance
$226,888
Interest Rate
3.5%
Mortgage Type
New Conventional
Estimated Equity
$257,541
Purchase Details
Closed on
Jan 18, 1999
Sold by
Jarvis Shad and Lerwill Pari
Bought by
Jarvis Shad
Purchase Details
Closed on
Sep 11, 1998
Sold by
Jarvis Lynette B
Bought by
Jarvis Shad and Lerwill Pari
Purchase Details
Closed on
Sep 15, 1997
Sold by
Jarvis Lynette B
Bought by
Collings Garold W and Collings Marilyn
Home Financials for this Owner
Home Financials are based on the most recent Mortgage that was taken out on this home.
Original Mortgage
$80,000
Interest Rate
7.45%
Create a Home Valuation Report for This Property
The Home Valuation Report is an in-depth analysis detailing your home's value as well as a comparison with similar homes in the area
Home Values in the Area
Average Home Value in this Area
Purchase History
| Date | Buyer | Sale Price | Title Company |
|---|---|---|---|
| Barnes Timothy T | -- | Sutherland Title Company | |
| Jarvis Shad | -- | Pro Title & Escrow Inc | |
| Jarvis Shad | -- | -- | |
| Collings Garold W | -- | -- |
Source: Public Records
Mortgage History
| Date | Status | Borrower | Loan Amount |
|---|---|---|---|
| Open | Barnes Timothy T | $261,900 | |
| Previous Owner | Collings Garold W | $80,000 |
Source: Public Records
Tax History
| Year | Tax Paid | Tax Assessment Tax Assessment Total Assessment is a certain percentage of the fair market value that is determined by local assessors to be the total taxable value of land and additions on the property. | Land | Improvement |
|---|---|---|---|---|
| 2025 | $2,342 | $262,460 | -- | -- |
| 2024 | $2,342 | $238,370 | $0 | $0 |
| 2023 | $2,293 | $234,025 | $0 | $0 |
| 2022 | $2,442 | $245,135 | $0 | $0 |
| 2021 | $2,020 | $325,200 | $94,800 | $230,400 |
| 2020 | $1,893 | $298,100 | $82,400 | $215,700 |
| 2019 | $1,712 | $276,500 | $71,100 | $205,400 |
| 2018 | $1,587 | $247,000 | $59,900 | $187,100 |
| 2017 | $726 | $126,665 | $0 | $0 |
| 2016 | $0 | $112,915 | $0 | $0 |
| 2015 | -- | $110,880 | $0 | $0 |
| 2014 | -- | $100,870 | $0 | $0 |
Source: Public Records
Map
Nearby Homes
- 533 S 700 W
- 626 S 800 W Unit 32
- 527 S 1000 W
- 1039 S 680 W
- 219 S Majestic W
- 221 S Majestic Meadows Dr
- 528 W 1150 S
- 1163 S 730 W
- 549 S Main St
- 1172 S 880 W
- 1152 W 1000 S
- 128 S 300 W
- 116 S 300 W
- 588 W Utah Ave
- 1024 S 1170 W
- 1128 W 1150 S Unit 9
- 1836 S 100 E
- 1192 W 1130 St S Unit 202
- 229 E 670 S Unit 7
- 252 E 670 S Unit 2