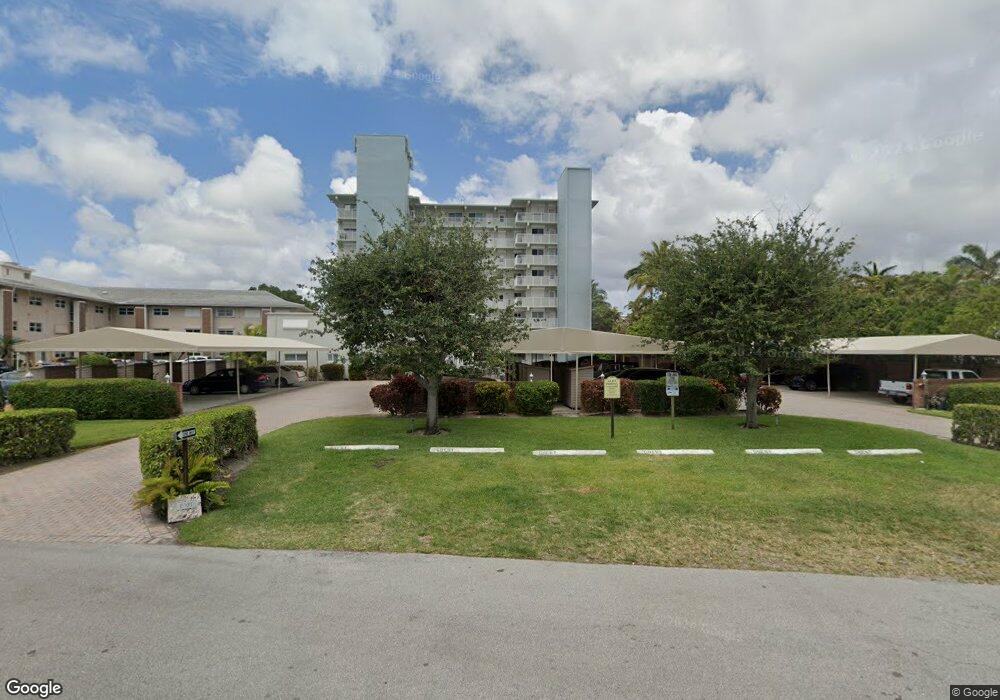
629 SE 19th Ave Unit 602 Deerfield Beach, FL 33441
Deerfield Beach Island NeighborhoodEstimated Value: $276,187 - $345,000
2
Beds
1
Bath
635
Sq Ft
$474/Sq Ft
Est. Value
About This Home
This home is located at 629 SE 19th Ave Unit 602, Deerfield Beach, FL 33441 and is currently estimated at $300,797, approximately $473 per square foot. 629 SE 19th Ave Unit 602 is a home located in Broward County with nearby schools including Deerfield Beach Elementary School, Deerfield Beach Middle School, and Deerfield Beach High School.
Ownership History
Date
Name
Owned For
Owner Type
Purchase Details
Closed on
Sep 15, 2020
Sold by
Toueg Rami
Bought by
Toueg Mony and Toueg Judith
Current Estimated Value
Purchase Details
Closed on
Jan 20, 2005
Sold by
Lega Eva
Bought by
Toueg Rami
Purchase Details
Closed on
May 28, 2004
Sold by
Kaiser Klaus
Bought by
Lega Eva
Purchase Details
Closed on
Jun 17, 1998
Sold by
Morabito John A
Bought by
Kaiser Klaus
Home Financials for this Owner
Home Financials are based on the most recent Mortgage that was taken out on this home.
Original Mortgage
$60,000
Interest Rate
7.14%
Purchase Details
Closed on
Jan 13, 1995
Sold by
Joanisse Lise
Bought by
Morabito John A
Home Financials for this Owner
Home Financials are based on the most recent Mortgage that was taken out on this home.
Original Mortgage
$42,000
Interest Rate
9.21%
Purchase Details
Closed on
Dec 1, 1980
Sold by
Available Not
Bought by
Available Not
Create a Home Valuation Report for This Property
The Home Valuation Report is an in-depth analysis detailing your home's value as well as a comparison with similar homes in the area
Home Values in the Area
Average Home Value in this Area
Purchase History
| Date | Buyer | Sale Price | Title Company |
|---|---|---|---|
| Toueg Mony | -- | Attorney | |
| Toueg Rami | $220,000 | Hillsboro Beach Title & Escr | |
| Lega Eva | $103,000 | -- | |
| Kaiser Klaus | $60,000 | -- | |
| Morabito John A | $67,000 | -- | |
| Available Not | $34,286 | -- |
Source: Public Records
Mortgage History
| Date | Status | Borrower | Loan Amount |
|---|---|---|---|
| Previous Owner | Kaiser Klaus | $60,000 | |
| Previous Owner | Morabito John A | $42,000 |
Source: Public Records
Tax History Compared to Growth
Tax History
| Year | Tax Paid | Tax Assessment Tax Assessment Total Assessment is a certain percentage of the fair market value that is determined by local assessors to be the total taxable value of land and additions on the property. | Land | Improvement |
|---|---|---|---|---|
| 2025 | $3,331 | $223,530 | -- | -- |
| 2024 | $3,385 | $217,240 | -- | -- |
| 2023 | $3,385 | $210,920 | $0 | $0 |
| 2022 | $3,182 | $204,780 | $0 | $0 |
| 2021 | $3,459 | $198,820 | $19,880 | $178,940 |
| 2020 | $3,466 | $157,140 | $15,710 | $141,430 |
| 2019 | $3,392 | $152,570 | $15,260 | $137,310 |
| 2018 | $3,405 | $157,110 | $15,710 | $141,400 |
| 2017 | $3,492 | $151,340 | $0 | $0 |
| 2016 | $3,114 | $137,590 | $0 | $0 |
| 2015 | $3,168 | $135,610 | $0 | $0 |
| 2014 | $3,014 | $123,830 | $0 | $0 |
| 2013 | -- | $112,580 | $11,260 | $101,320 |
Source: Public Records
Map
Nearby Homes
- 745 SE 19th Ave Unit 134
- 745 SE 19th Ave Unit 138
- 1580 SE 8th St
- 701 SE 21st Ave Unit 103
- 701 SE 21st Ave Unit 306
- 701 SE 21st Ave Unit 109
- 701 SE 21st Ave Unit 302
- 701 SE 21st Ave Unit 503
- 665 SE 21st Ave Unit 107
- 665 SE 21st Ave Unit 502
- 330 SE 19th Ave Unit E
- 800 SE 20th Ave Unit 303
- 800 SE 20th Ave Unit 915
- 800 SE 20th Ave Unit 1109
- 800 SE 20th Ave Unit 1115
- 445 SE 21st Ave Unit 202
- 985 SE 19th Ave Unit 204
- 1525 SE 6th St
- 961 SE 20th Ave Unit 308
- 1540 SE 9th St
- 629 SE 19th Ave Unit VIL. A
- 629 SE 19th Ave
- 629 SE 19th Ave Unit 503
- 629 SE 19th Ave Unit 402
- 629 SE 19th Ave Unit 204
- 629 SE 19th Ave Unit A
- 629 SE 19th Ave Unit 504
- 629 SE 19th Ave Unit 603
- 629 SE 19th Ave Unit 702
- 629 SE 19th Ave Unit 304
- 629 SE 19th Ave Unit 404
- 629 SE 19th Ave Unit C
- 629 SE 19th Ave Unit 803
- 629 SE 19th Ave Unit 704
- 629 SE 19th Ave Unit 701
- 629 SE 19th Ave Unit 501
- 629 SE 19th Ave Unit 802
- 629 SE 19th Ave Unit 703
- 629 SE 19th Ave Unit 303
- 629 SE 19th Ave Unit 604