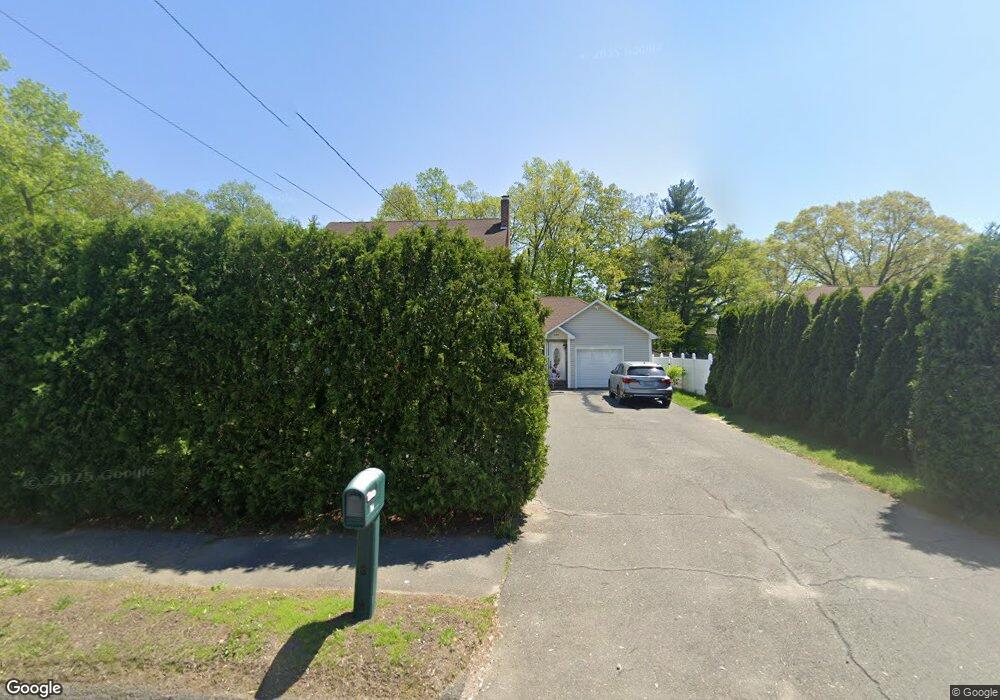
629 Suffield St Agawam, MA 01001
Estimated Value: $359,000 - $491,000
3
Beds
1
Bath
1,217
Sq Ft
$351/Sq Ft
Est. Value
About This Home
This home is located at 629 Suffield St, Agawam, MA 01001 and is currently estimated at $427,670, approximately $351 per square foot. 629 Suffield St is a home located in Hampden County with nearby schools including Agawam Junior High School and Agawam High School.
Ownership History
Date
Name
Owned For
Owner Type
Purchase Details
Closed on
Dec 3, 2004
Sold by
Fusco Joseph
Bought by
Kaptyug Petr and Kaptyug Yelena
Current Estimated Value
Home Financials for this Owner
Home Financials are based on the most recent Mortgage that was taken out on this home.
Original Mortgage
$127,050
Outstanding Balance
$63,457
Interest Rate
5.69%
Mortgage Type
Purchase Money Mortgage
Estimated Equity
$364,213
Purchase Details
Closed on
Jun 2, 2004
Sold by
Laplante John P
Bought by
Fusco Joseph
Purchase Details
Closed on
Dec 29, 1995
Sold by
Modzeleski Mark C
Bought by
Laplante John P
Home Financials for this Owner
Home Financials are based on the most recent Mortgage that was taken out on this home.
Original Mortgage
$91,650
Interest Rate
7.33%
Mortgage Type
Purchase Money Mortgage
Create a Home Valuation Report for This Property
The Home Valuation Report is an in-depth analysis detailing your home's value as well as a comparison with similar homes in the area
Home Values in the Area
Average Home Value in this Area
Purchase History
| Date | Buyer | Sale Price | Title Company |
|---|---|---|---|
| Kaptyug Petr | $165,000 | -- | |
| Fusco Joseph | $120,000 | -- | |
| Laplante John P | $89,900 | -- |
Source: Public Records
Mortgage History
| Date | Status | Borrower | Loan Amount |
|---|---|---|---|
| Open | Kaptyug Petr | $127,050 | |
| Closed | Kaptyug Petr | $33,000 | |
| Previous Owner | Laplante John P | $108,000 | |
| Previous Owner | Laplante John P | $91,650 | |
| Previous Owner | Laplante John P | $59,000 |
Source: Public Records
Tax History
| Year | Tax Paid | Tax Assessment Tax Assessment Total Assessment is a certain percentage of the fair market value that is determined by local assessors to be the total taxable value of land and additions on the property. | Land | Improvement |
|---|---|---|---|---|
| 2025 | $5,907 | $403,500 | $113,900 | $289,600 |
| 2024 | $5,732 | $394,200 | $113,900 | $280,300 |
| 2023 | $5,959 | $377,600 | $102,400 | $275,200 |
| 2022 | $5,664 | $351,600 | $102,400 | $249,200 |
| 2021 | $5,183 | $308,500 | $88,400 | $220,100 |
| 2020 | $5,059 | $300,600 | $86,900 | $213,700 |
| 2019 | $4,809 | $288,800 | $85,000 | $203,800 |
| 2018 | $4,418 | $266,000 | $80,500 | $185,500 |
| 2017 | $3,466 | $212,500 | $80,600 | $131,900 |
| 2016 | $2,909 | $179,800 | $80,600 | $99,200 |
| 2015 | $2,764 | $175,600 | $80,600 | $95,000 |
Source: Public Records
Map
Nearby Homes
- 29 Valentine St
- 190 Mill St
- 762 Suffield St
- 73 Silver Lake Dr
- 105 Edgewater Rd
- 0 Silver St
- 4H Mapleviewlane Unit 4H
- 7 Castle Hill Rd Unit G
- 13 Castle Hills Rd Unit B
- 712 Cooper St
- 15 B Castle Hills Rd Unit B
- 354 Rowley St
- 88 Country Rd
- 32 Lealand Ave
- 304-306 Cooper St
- 554-556 Franklin Street Extension
- 178 Beekman Dr
- 1077 Main St
- 25 Damato Way
- 47 Corey Colonial
- 635 Suffield St
- 621 Suffield St
- 615 Suffield St
- 25 Poinsetta St
- 0 Aspenwood Ln Unit 72297298
- 1 Aspenwood Ln
- 17 Poinsetta St
- 624 Suffield St
- 48 Mill St
- 611 Suffield St
- 31 Poinsetta St
- 636 Suffield St
- 630 Suffield St
- 40 Mill St
- 616 Suffield St
- 33 Poinsetta St
- 603 Suffield St
- 603 Suffield St Unit (603)
- 9 Poinsetta St
- 18 Poinsetta St