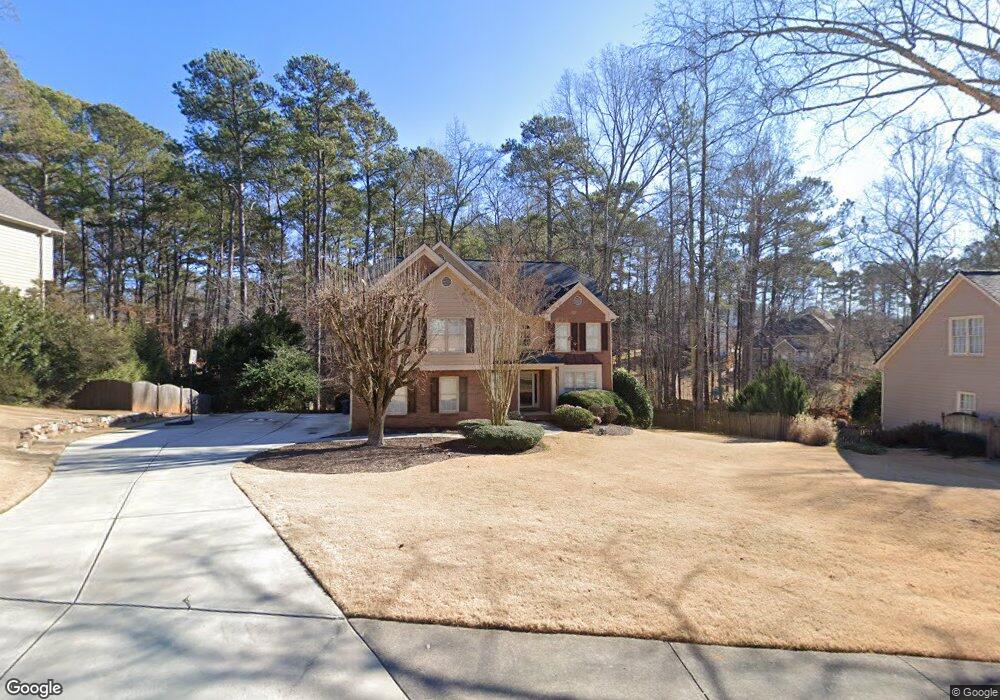
6291 Braidwood Run NW Acworth, GA 30101
West Cobb NeighborhoodEstimated Value: $545,876 - $614,000
4
Beds
3
Baths
2,996
Sq Ft
$192/Sq Ft
Est. Value
About This Home
This home is located at 6291 Braidwood Run NW, Acworth, GA 30101 and is currently estimated at $576,219, approximately $192 per square foot. 6291 Braidwood Run NW is a home located in Cobb County with nearby schools including Vaughan Elementary School, Lost Mountain Middle School, and Harrison High School.
Ownership History
Date
Name
Owned For
Owner Type
Purchase Details
Closed on
Apr 5, 2007
Sold by
Ellis John C
Bought by
Ellis John C and Ellis Shannon M
Current Estimated Value
Home Financials for this Owner
Home Financials are based on the most recent Mortgage that was taken out on this home.
Original Mortgage
$28,400
Interest Rate
6.1%
Mortgage Type
New Conventional
Purchase Details
Closed on
Jul 23, 2003
Sold by
Rogan Joseph H and Rogan Laura A
Bought by
Sebok Eric B and Sebok Melissa
Home Financials for this Owner
Home Financials are based on the most recent Mortgage that was taken out on this home.
Original Mortgage
$210,000
Interest Rate
5.52%
Mortgage Type
New Conventional
Purchase Details
Closed on
Mar 13, 1996
Sold by
Rodric Builders Inc
Bought by
Rogan Joseph H Laura A
Create a Home Valuation Report for This Property
The Home Valuation Report is an in-depth analysis detailing your home's value as well as a comparison with similar homes in the area
Home Values in the Area
Average Home Value in this Area
Purchase History
| Date | Buyer | Sale Price | Title Company |
|---|---|---|---|
| Ellis John C | -- | -- | |
| Ellis John C | $284,900 | -- | |
| Sebok Eric B | $265,000 | -- | |
| Rogan Joseph H Laura A | $188,900 | -- |
Source: Public Records
Mortgage History
| Date | Status | Borrower | Loan Amount |
|---|---|---|---|
| Closed | Ellis John C | $28,400 | |
| Previous Owner | Sebok Eric B | $210,000 | |
| Closed | Rogan Joseph H Laura A | $0 |
Source: Public Records
Tax History Compared to Growth
Tax History
| Year | Tax Paid | Tax Assessment Tax Assessment Total Assessment is a certain percentage of the fair market value that is determined by local assessors to be the total taxable value of land and additions on the property. | Land | Improvement |
|---|---|---|---|---|
| 2024 | $5,435 | $220,720 | $46,000 | $174,720 |
| 2023 | $4,318 | $194,240 | $34,000 | $160,240 |
| 2022 | $4,325 | $168,064 | $24,000 | $144,064 |
| 2021 | $3,763 | $142,400 | $24,000 | $118,400 |
| 2020 | $3,547 | $132,524 | $24,000 | $108,524 |
| 2019 | $3,547 | $132,524 | $24,000 | $108,524 |
| 2018 | $3,295 | $121,024 | $24,000 | $97,024 |
| 2017 | $3,139 | $121,024 | $24,000 | $97,024 |
| 2016 | $2,671 | $101,796 | $24,000 | $77,796 |
| 2015 | $2,739 | $101,796 | $24,000 | $77,796 |
| 2014 | $2,762 | $101,796 | $0 | $0 |
Source: Public Records
Map
Nearby Homes
- 654 Braidwood Dr NW
- 6246 Braidwood Way NW
- 6128 Braidwood Ln NW
- 3391 Due Rd W
- 6211 Woodlore Dr NW
- 6100 Braidwood Ct NW
- 691 Braidwood Terrace NW
- 6011 Fairlong Ct NW
- 6309 Manassas Pass NW
- 956 Fairlong Dr NW
- 0 Paige St
- 5725 Fairwood Dr NW
- 6280 Wiscasset Pkwy NW
- 582 Braidwood Dr NW
- 6049 Braidwood Close NW Unit 5
- 863 Fairwood Pointe NW
- 6416 Vicksburg Ct NW
- 284 Due Ct W
- 6289 Braidwood Run NW
- 6293 Braidwood Run NW
- 6287 Braidwood Run NW Unit 7
- 6290 Braidwood Run NW
- 6292 Braidwood Run NW
- 6211 Braidwood Way NW Unit 8
- 6295 Braidwood Run NW
- 6288 Braidwood Run NW
- 640 Braidwood Dr NW
- 636 Braidwood Dr NW Unit 6
- 6294 Braidwood Run NW
- 638 Braidwood Dr NW
- 6215 Braidwood Way NW Unit 8
- 6173 Braidwood Ave NW
- 6286 Braidwood Run NW Unit 6266
- 6286 Braidwood Run NW
- 634 Braidwood Dr NW
- 6171 Braidwood Ave NW
- 6297 Braidwood Run NW
- 646 Braidwood Dr NW