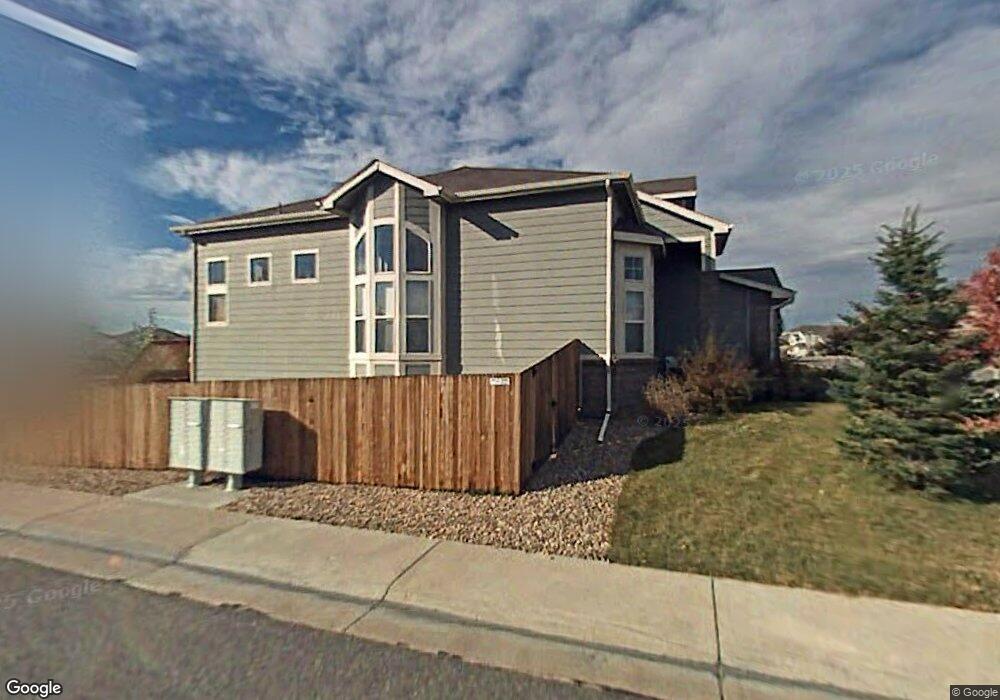
6291 S Valdai Ct Aurora, CO 80015
Saddle Rock Ridge NeighborhoodEstimated Value: $673,898 - $717,000
3
Beds
3
Baths
2,668
Sq Ft
$260/Sq Ft
Est. Value
About This Home
This home is located at 6291 S Valdai Ct, Aurora, CO 80015 and is currently estimated at $692,975, approximately $259 per square foot. 6291 S Valdai Ct is a home located in Arapahoe County with nearby schools including Canyon Creek Elementary School, Thunder Ridge Middle School, and Cherokee Trail High School.
Ownership History
Date
Name
Owned For
Owner Type
Purchase Details
Closed on
Jan 29, 2021
Sold by
Mentzer Lee
Bought by
Khalidova Fikriya and Khalidov Zakhaddin
Current Estimated Value
Home Financials for this Owner
Home Financials are based on the most recent Mortgage that was taken out on this home.
Original Mortgage
$375,000
Outstanding Balance
$334,814
Interest Rate
2.6%
Mortgage Type
New Conventional
Estimated Equity
$358,161
Purchase Details
Closed on
Aug 10, 2011
Sold by
Jung Kim Jae Bum and Jung Hyun
Bought by
Mentzer Lee
Home Financials for this Owner
Home Financials are based on the most recent Mortgage that was taken out on this home.
Original Mortgage
$325,395
Interest Rate
4.53%
Mortgage Type
VA
Purchase Details
Closed on
May 15, 2002
Sold by
D R Horton Inc
Bought by
Jung Kim Jae Bum and Jung Kim Hyun
Home Financials for this Owner
Home Financials are based on the most recent Mortgage that was taken out on this home.
Original Mortgage
$285,000
Interest Rate
7.1%
Create a Home Valuation Report for This Property
The Home Valuation Report is an in-depth analysis detailing your home's value as well as a comparison with similar homes in the area
Home Values in the Area
Average Home Value in this Area
Purchase History
| Date | Buyer | Sale Price | Title Company |
|---|---|---|---|
| Khalidova Fikriya | $585,000 | First American Title | |
| Mentzer Lee | $315,000 | Land Title Guarantee Company | |
| Jung Kim Jae Bum | $335,000 | -- |
Source: Public Records
Mortgage History
| Date | Status | Borrower | Loan Amount |
|---|---|---|---|
| Open | Khalidova Fikriya | $375,000 | |
| Previous Owner | Mentzer Lee | $325,395 | |
| Previous Owner | Jung Kim Jae Bum | $285,000 |
Source: Public Records
Tax History Compared to Growth
Tax History
| Year | Tax Paid | Tax Assessment Tax Assessment Total Assessment is a certain percentage of the fair market value that is determined by local assessors to be the total taxable value of land and additions on the property. | Land | Improvement |
|---|---|---|---|---|
| 2024 | $4,688 | $45,011 | -- | -- |
| 2023 | $4,688 | $45,011 | $0 | $0 |
| 2022 | $4,058 | $34,798 | $0 | $0 |
| 2021 | $4,029 | $34,798 | $0 | $0 |
| 2020 | $3,847 | $33,412 | $0 | $0 |
| 2019 | $3,733 | $33,412 | $0 | $0 |
| 2018 | $3,774 | $30,751 | $0 | $0 |
| 2017 | $3,719 | $30,751 | $0 | $0 |
| 2016 | $3,671 | $29,022 | $0 | $0 |
| 2015 | $3,561 | $29,022 | $0 | $0 |
| 2014 | $3,251 | $24,397 | $0 | $0 |
| 2013 | -- | $24,620 | $0 | $0 |
Source: Public Records
Map
Nearby Homes
- 6261 S Sicily Way
- 22463 E Weaver Dr
- 6018 S Winnipeg St
- 5973 S Wenatchee St
- 6055 S Shawnee St
- 5932 S Versailles St
- 23286 E Lake Place
- 22019 E Arbor Dr
- 5904 S Ukraine St
- 22192 E Alamo Ln
- 23201 E Orchard Place
- 22685 E Calhoun Place
- 23032 E Alamo Place
- 22742 E Calhoun Place
- 6533 S Quemoy Way
- 5755 S Zante Cir
- 22905 E Ontario Dr Unit 106
- 22675 E Ontario Dr Unit 202
- 22675 E Ontario Dr Unit 104
- 22545 E Ontario Dr Unit 103
- 6281 S Valdai Ct
- 6307 S Valdai Ct
- 6271 S Valdai Ct
- 6306 S Ukraine Ct
- 6292 S Valdai Ct
- 6282 S Valdai Ct
- 6294 S Tempe Way
- 6317 S Valdai Ct
- 6261 S Valdai Ct
- 6308 S Valdai Ct
- 6272 S Valdai Ct
- 6326 S Ukraine Ct
- 6305 S Ukraine Ct
- 6284 S Tempe Way
- 6251 S Valdai Ct
- 6337 S Valdai Ct
- 6318 S Valdai Ct
- 6262 S Valdai Ct
- 6356 S Ukraine Ct
- 6325 S Ukraine Ct