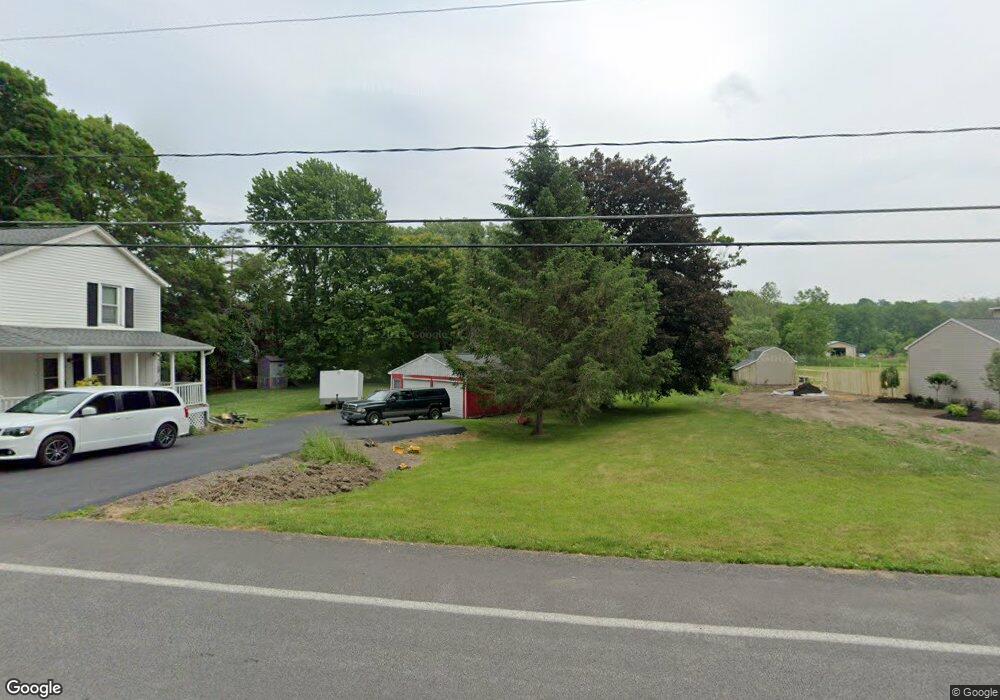
6292 Dyke Rd Chittenango, NY 13037
Estimated Value: $214,000 - $254,000
2
Beds
2
Baths
1,194
Sq Ft
$199/Sq Ft
Est. Value
About This Home
This home is located at 6292 Dyke Rd, Chittenango, NY 13037 and is currently estimated at $237,239, approximately $198 per square foot. 6292 Dyke Rd is a home located in Madison County with nearby schools including Chittenango High School.
Ownership History
Date
Name
Owned For
Owner Type
Purchase Details
Closed on
Jul 2, 2015
Sold by
French Jeffrey
Bought by
Jackson Aaron
Current Estimated Value
Home Financials for this Owner
Home Financials are based on the most recent Mortgage that was taken out on this home.
Original Mortgage
$112,425
Outstanding Balance
$87,693
Interest Rate
3.87%
Mortgage Type
FHA
Estimated Equity
$149,546
Purchase Details
Closed on
Jun 9, 2011
Sold by
Graf Peter
Bought by
French Jeffrey
Home Financials for this Owner
Home Financials are based on the most recent Mortgage that was taken out on this home.
Original Mortgage
$110,518
Interest Rate
4.81%
Mortgage Type
FHA
Purchase Details
Closed on
Jun 27, 2003
Sold by
Snyder L Matthew
Bought by
Graf Peter M
Purchase Details
Closed on
Jun 28, 2002
Sold by
Stearns Robert E
Bought by
Snyder L
Purchase Details
Closed on
Aug 8, 1996
Sold by
Darmento Peter P and Darmento Janice P
Bought by
Stearns Robert E
Create a Home Valuation Report for This Property
The Home Valuation Report is an in-depth analysis detailing your home's value as well as a comparison with similar homes in the area
Home Values in the Area
Average Home Value in this Area
Purchase History
| Date | Buyer | Sale Price | Title Company |
|---|---|---|---|
| Jackson Aaron | $110,000 | William Drexler | |
| French Jeffrey | $106,650 | David Vickery | |
| Graf Peter M | $83,300 | Vaughn D Lang | |
| Snyder L | $74,300 | -- | |
| Stearns Robert E | $67,000 | -- |
Source: Public Records
Mortgage History
| Date | Status | Borrower | Loan Amount |
|---|---|---|---|
| Open | Jackson Aaron | $112,425 | |
| Previous Owner | French Jeffrey | $110,518 |
Source: Public Records
Tax History
| Year | Tax Paid | Tax Assessment Tax Assessment Total Assessment is a certain percentage of the fair market value that is determined by local assessors to be the total taxable value of land and additions on the property. | Land | Improvement |
|---|---|---|---|---|
| 2024 | $4,112 | $105,100 | $23,200 | $81,900 |
| 2023 | $4,083 | $105,100 | $23,200 | $81,900 |
| 2022 | $3,925 | $105,100 | $23,200 | $81,900 |
| 2021 | $3,898 | $105,100 | $23,200 | $81,900 |
| 2020 | $3,815 | $105,100 | $23,200 | $81,900 |
| 2019 | $3,695 | $105,100 | $23,200 | $81,900 |
| 2018 | $3,695 | $105,100 | $23,200 | $81,900 |
| 2017 | $3,698 | $105,100 | $23,200 | $81,900 |
| 2016 | $3,686 | $105,100 | $23,200 | $81,900 |
| 2015 | -- | $105,100 | $23,200 | $81,900 |
| 2014 | -- | $105,100 | $23,200 | $81,900 |
Source: Public Records
Map
Nearby Homes
- 110 Schuyler Dr
- 117 Hawthorne Way
- 9010 Kennedy Ln Ln
- 620 Cain St
- 628 Lakeport Rd
- 200 Mohawk St
- 000 Warren St
- 524 Tuscarora Rd
- 146 Hawthorne Way
- 2233 Gidran Dr
- 0 Walnut Point Rd Unit S1594837
- 0 Walnut Point Rd Unit S1594838
- 5857 E Lake Rd
- 1011 Gill St
- 7053 Lakeport Rd
- 5565 Ridge Rd
- 6749 Ramsgate Rd
- 2249 Gidran Dr
- 2237 Gidran Dr
- 2229 Gidran Dr
Your Personal Tour Guide
Ask me questions while you tour the home.