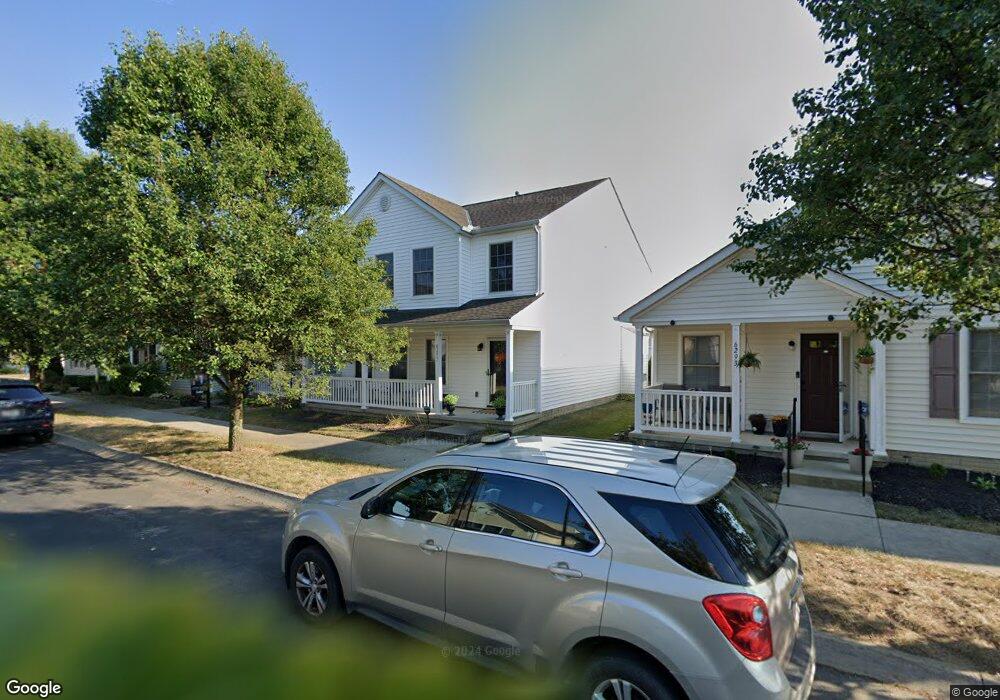
6295 Tarklin St Unit 57 Canal Winchester, OH 43110
East Columbus-White Ash NeighborhoodEstimated Value: $260,000 - $292,897
4
Beds
3
Baths
1,818
Sq Ft
$152/Sq Ft
Est. Value
About This Home
This home is located at 6295 Tarklin St Unit 57, Canal Winchester, OH 43110 and is currently estimated at $276,474, approximately $152 per square foot. 6295 Tarklin St Unit 57 is a home located in Franklin County with nearby schools including Liberty Elementary School, Yorktown Middle School, and Independence High School.
Ownership History
Date
Name
Owned For
Owner Type
Purchase Details
Closed on
Nov 9, 2020
Sold by
Brown Todd C
Bought by
Botley Mallory K
Current Estimated Value
Home Financials for this Owner
Home Financials are based on the most recent Mortgage that was taken out on this home.
Original Mortgage
$179,000
Outstanding Balance
$159,285
Interest Rate
2.8%
Mortgage Type
New Conventional
Estimated Equity
$117,189
Purchase Details
Closed on
Jan 24, 2008
Sold by
White Robyn T
Bought by
Brown Todd C
Purchase Details
Closed on
Sep 28, 2006
Sold by
Dominion Homes Inc
Bought by
White Robyn T
Home Financials for this Owner
Home Financials are based on the most recent Mortgage that was taken out on this home.
Original Mortgage
$135,082
Interest Rate
6.58%
Mortgage Type
FHA
Create a Home Valuation Report for This Property
The Home Valuation Report is an in-depth analysis detailing your home's value as well as a comparison with similar homes in the area
Home Values in the Area
Average Home Value in this Area
Purchase History
| Date | Buyer | Sale Price | Title Company |
|---|---|---|---|
| Botley Mallory K | $189,000 | Associates Title Inc | |
| Brown Todd C | $110,000 | Chicago Tit | |
| White Robyn T | $136,200 | Alliance Ti |
Source: Public Records
Mortgage History
| Date | Status | Borrower | Loan Amount |
|---|---|---|---|
| Open | Botley Mallory K | $179,000 | |
| Previous Owner | White Robyn T | $135,082 |
Source: Public Records
Tax History Compared to Growth
Tax History
| Year | Tax Paid | Tax Assessment Tax Assessment Total Assessment is a certain percentage of the fair market value that is determined by local assessors to be the total taxable value of land and additions on the property. | Land | Improvement |
|---|---|---|---|---|
| 2024 | $3,861 | $86,030 | $17,150 | $68,880 |
| 2023 | $3,812 | $86,030 | $17,150 | $68,880 |
| 2022 | $2,466 | $47,540 | $7,390 | $40,150 |
| 2021 | $2,470 | $47,540 | $7,390 | $40,150 |
| 2020 | $2,473 | $47,540 | $7,390 | $40,150 |
| 2019 | $2,334 | $38,470 | $6,160 | $32,310 |
| 2018 | $2,315 | $38,470 | $6,160 | $32,310 |
| 2017 | $2,332 | $38,470 | $6,160 | $32,310 |
| 2016 | $2,534 | $38,260 | $5,880 | $32,380 |
| 2015 | $2,301 | $38,260 | $5,880 | $32,380 |
| 2014 | $2,306 | $38,260 | $5,880 | $32,380 |
| 2013 | $1,198 | $40,285 | $6,195 | $34,090 |
Source: Public Records
Map
Nearby Homes
- 6289 Tarklin St
- 5422 Wrigley St
- 6773 Laburnum Dr
- 6790 Laburnum Dr
- 5171 Aquila Dr Unit 42E
- 5870 Winchester Pike
- 5112 Clermonte Dr
- 6757 Lagrange Dr Unit 57A
- 6755 Axtel Dr Unit 14C
- 6772 Hamler Dr Unit 25B
- 6088 Green Bay Ct
- 6697 Fallon Ln
- Fairton Plan at Brookview
- Henley Plan at Brookview
- Bellamy Plan at Brookview
- Pendleton Plan at Brookview
- Sienna Plan at Brookview
- Juniper Plan at Brookview
- Chatham Plan at Brookview
- Harmony Plan at Brookview
- 6295 Tarklin St
- 6293 Tarklin St
- 6293 Tarklin St Unit 56
- 6301 Tarklin St
- 6305 Tarklin St
- 6296 Artesia Dr
- 6302 Artesia Dr
- 6302 Artesia Dr Unit 53
- 6294 Artesia Dr
- 6294 Artesia Dr Unit 51
- 6290 Artesia Dr
- 6306 Artesia Dr
- 6306 Artesia Dr Unit 54
- 6294 Tarklin St
- 6294 Tarklin St Unit 62
- 6292 Tarklin St
- 6300 Tarklin St
- 6300 Tarklin St Unit 63
- 6288 Tarklin St
- 6304 Tarklin St