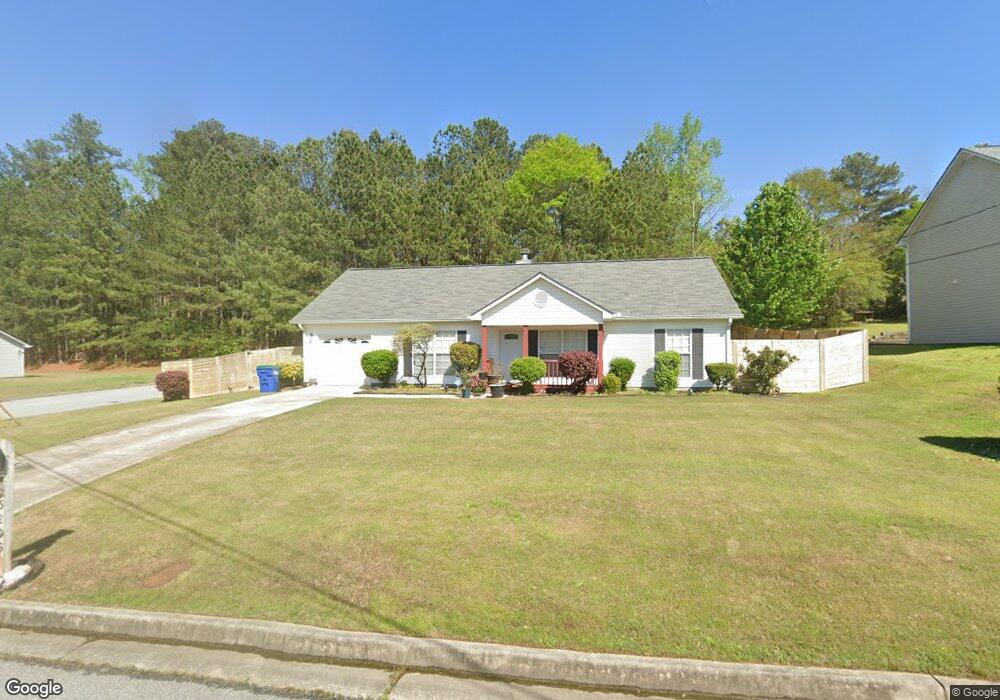
6295 Topaz Trail Atlanta, GA 30349
Estimated Value: $212,000 - $257,000
3
Beds
2
Baths
1,434
Sq Ft
$160/Sq Ft
Est. Value
About This Home
This home is located at 6295 Topaz Trail, Atlanta, GA 30349 and is currently estimated at $228,732, approximately $159 per square foot. 6295 Topaz Trail is a home located in Fulton County with nearby schools including Nolan Elementary School, Mcnair Middle School, and Banneker High School.
Ownership History
Date
Name
Owned For
Owner Type
Purchase Details
Closed on
Oct 23, 2007
Sold by
Fannie Mae
Bought by
Varnon Maria J
Current Estimated Value
Home Financials for this Owner
Home Financials are based on the most recent Mortgage that was taken out on this home.
Original Mortgage
$95,900
Outstanding Balance
$60,023
Interest Rate
6.26%
Mortgage Type
New Conventional
Estimated Equity
$168,709
Purchase Details
Closed on
Jun 5, 2007
Sold by
Maxwell Sean B
Bought by
Netbank
Purchase Details
Closed on
Jan 31, 2003
Sold by
Joy Built Hms Inc
Bought by
Maxwell Sean B
Home Financials for this Owner
Home Financials are based on the most recent Mortgage that was taken out on this home.
Original Mortgage
$115,300
Interest Rate
5.95%
Mortgage Type
New Conventional
Purchase Details
Closed on
Nov 2, 1999
Sold by
Hunton Inetta L
Bought by
Federal National Mortgage Association
Create a Home Valuation Report for This Property
The Home Valuation Report is an in-depth analysis detailing your home's value as well as a comparison with similar homes in the area
Home Values in the Area
Average Home Value in this Area
Purchase History
| Date | Buyer | Sale Price | Title Company |
|---|---|---|---|
| Varnon Maria J | -- | -- | |
| Netbank | $123,285 | -- | |
| Maxwell Sean B | $115,400 | -- | |
| Federal National Mortgage Association | $66,700 | -- |
Source: Public Records
Mortgage History
| Date | Status | Borrower | Loan Amount |
|---|---|---|---|
| Open | Varnon Maria J | $95,900 | |
| Previous Owner | Maxwell Sean B | $115,300 |
Source: Public Records
Tax History Compared to Growth
Tax History
| Year | Tax Paid | Tax Assessment Tax Assessment Total Assessment is a certain percentage of the fair market value that is determined by local assessors to be the total taxable value of land and additions on the property. | Land | Improvement |
|---|---|---|---|---|
| 2025 | $606 | $104,440 | $23,120 | $81,320 |
| 2023 | $2,464 | $87,280 | $24,120 | $63,160 |
| 2022 | $391 | $41,000 | $4,000 | $37,000 |
| 2021 | $381 | $39,800 | $3,880 | $35,920 |
| 2020 | $380 | $39,280 | $3,800 | $35,480 |
| 2019 | $469 | $38,640 | $3,760 | $34,880 |
| 2018 | $447 | $26,760 | $2,760 | $24,000 |
| 2017 | $278 | $16,760 | $2,800 | $13,960 |
| 2016 | $277 | $16,760 | $2,800 | $13,960 |
| 2015 | $278 | $16,760 | $2,800 | $13,960 |
| 2014 | $279 | $16,760 | $2,800 | $13,960 |
Source: Public Records
Map
Nearby Homes
- 6278 Rockaway Rd
- 6265 Gemstone Ct
- 2700 Woodward Rd
- 2500 Woodward Rd
- 0 Old National Hwy Unit 10585141
- 0 Old National Hwy Unit 25259755
- 0 Old National Hwy Unit 7633279
- 340 Onyx Ct
- 6305 Emerald Pointe Cir
- 6041 Hemperly Rd
- 6037 Hemperly Rd
- 0 Flat Shoals Rd Unit 10214526
- 0 Flat Shoals Rd Unit 7513975
- 6022 Centennial Run
- 1005 Winter Side Ln Unit 2
- 1005 Winterside Ln
- 6085 Oak Bend Ct
- 6354 Olmadison Place
- 6148 Hemperly Rd
- 2317 Hackamore Dr
- 6305 Topaz Trail Unit 10
- 6305 Topaz Trail
- 6275 Topaz Trail
- 6315 Topaz Trail
- 6300 Topaz Trail
- 6122 Rockaway Rd
- 6122 Rockaway Rd Unit 58
- 6110 Rockaway Rd
- 6110 Rockaway Rd Unit 61
- 6106 Rockaway Rd
- 6310 Topaz Trail
- 6098 Rockaway Rd
- 6150 Rockaway Rd
- 6094 Rockaway Rd
- 6090 Rockaway Rd Unit 65
- 6162 Rockaway Rd
- 6325 Topaz Trail
- 810 Old Rocky Rd
- 6265 Topaz Trail Unit 13
- 6265 Topaz Trail