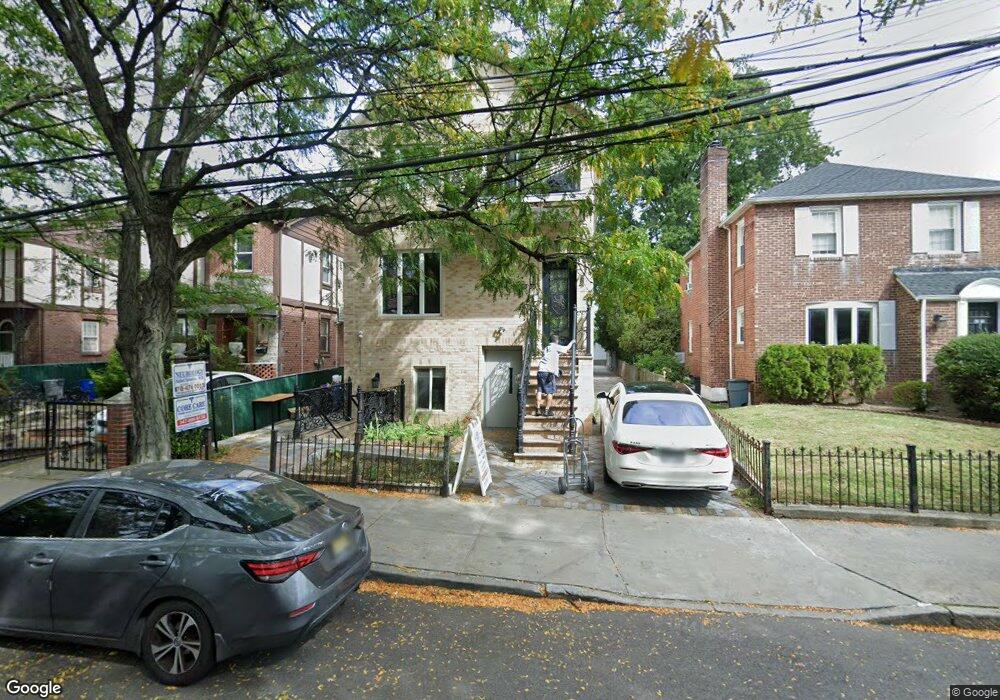
63-33 Alderton St Unit 2 Rego Park, NY 11374
Rego Park NeighborhoodEstimated Value: $1,988,000 - $2,545,489
4
Beds
4
Baths
6,105
Sq Ft
$371/Sq Ft
Est. Value
About This Home
This home is located at 63-33 Alderton St Unit 2, Rego Park, NY 11374 and is currently estimated at $2,266,745, approximately $371 per square foot. 63-33 Alderton St Unit 2 is a home located in Queens County with nearby schools including P.S. 139 Rego Park, J.H.S. 190 Russell Sage, and Forest Hills High School.
Ownership History
Date
Name
Owned For
Owner Type
Purchase Details
Closed on
Sep 16, 2015
Sold by
Yakutilov Benion and Yakutilova Raya
Bought by
Yakutilov Benion and Yakutilova Raya
Current Estimated Value
Purchase Details
Closed on
Jan 30, 2015
Sold by
Deborah Meizlik Successor Trustee and Rose Friedman
Bought by
Yakutilov Benion and Yakutilova Raya
Home Financials for this Owner
Home Financials are based on the most recent Mortgage that was taken out on this home.
Original Mortgage
$400,000
Interest Rate
3.9%
Mortgage Type
New Conventional
Purchase Details
Closed on
Jun 3, 2004
Sold by
Friedman Rose
Bought by
Of The Rose Friedman Revocable Trust and Rose Friedman As Trustee
Purchase Details
Closed on
Apr 16, 1997
Sold by
Friedman Leo and Friedman Rose
Bought by
Friedman Leo and Friedman Rose
Create a Home Valuation Report for This Property
The Home Valuation Report is an in-depth analysis detailing your home's value as well as a comparison with similar homes in the area
Home Values in the Area
Average Home Value in this Area
Purchase History
| Date | Buyer | Sale Price | Title Company |
|---|---|---|---|
| Yakutilov Benion | -- | -- | |
| Yakutilov Benion | -- | -- | |
| Yakutilov Benion | $985,000 | -- | |
| Yakutilov Benion | $985,000 | -- | |
| Of The Rose Friedman Revocable Trust | -- | -- | |
| Friedman Rose | -- | -- | |
| Of The Rose Friedman Revocable Trust | -- | -- | |
| Friedman Rose | -- | -- | |
| Friedman Leo | -- | Chicago Title Insurance Co | |
| Friedman Leo | -- | Chicago Title Insurance Co |
Source: Public Records
Mortgage History
| Date | Status | Borrower | Loan Amount |
|---|---|---|---|
| Previous Owner | Yakutilov Benion | $400,000 |
Source: Public Records
Tax History Compared to Growth
Tax History
| Year | Tax Paid | Tax Assessment Tax Assessment Total Assessment is a certain percentage of the fair market value that is determined by local assessors to be the total taxable value of land and additions on the property. | Land | Improvement |
|---|---|---|---|---|
| 2025 | $18,599 | $93,718 | $14,893 | $78,825 |
| 2024 | $18,599 | $92,603 | $14,285 | $78,318 |
| 2023 | $17,625 | $87,754 | $13,032 | $74,722 |
| 2022 | $16,527 | $152,820 | $27,240 | $125,580 |
| 2021 | $16,436 | $144,420 | $27,240 | $117,180 |
| 2020 | $16,531 | $141,720 | $27,240 | $114,480 |
| 2019 | $16,143 | $138,600 | $27,240 | $111,360 |
| 2018 | $15,049 | $73,822 | $14,635 | $59,187 |
| 2017 | $10,978 | $53,852 | $17,820 | $36,032 |
| 2016 | $7,067 | $53,852 | $17,820 | $36,032 |
| 2015 | $4,224 | $36,901 | $21,415 | $15,486 |
| 2014 | $4,224 | $36,127 | $23,492 | $12,635 |
Source: Public Records
Map
Nearby Homes
- 6324 Alderton St
- 90-2 63rd Dr Unit 5C
- 90-02 63rd Dr Unit 5J
- 62-66 Austin St
- 87-30 62nd Ave Unit 7
- 87-30 62nd Ave Unit 10A
- 87-30 62nd Ave Unit 5
- 63-95 Austin St Unit 2C
- 63-95 Austin St Unit 6G
- 63-95 Austin St Unit 5F
- 6395 Austin St Unit 2F
- 63-88 Wetherole St
- 86-31 62nd Ave
- 62-98 Saunders St Unit 5-N
- 6111 Alderton St
- 63-45 Saunders St Unit 3G
- 63-45 Saunders St Unit 5-G
- 63-45 Saunders St Unit 2D
- 62-98 Woodhaven Blvd Unit 6F
- 62-98 Woodhaven Blvd Unit 3
- 63-33 Alderton St
- 6333 Alderton St
- 6329 Alderton St
- 6335 Alderton St
- 6325 Alderton St
- 6339 Alderton St
- 63-21 Alderton St Unit Lower
- 63-21 Alderton St
- 6321 Alderton St
- 6343 Alderton St
- 6345 Alderton St Unit 2
- 63-19 Alderton St Unit 2
- 6319 Alderton St
- 6345 Alderton St
- 63-17 Alderton St Unit 2
- 6317 Alderton St
- 63-36 Alderton St Unit 2
- 63-36 Alderton St
- 63-30 Alderton St Unit 1
- 63-30 Alderton St Unit 2