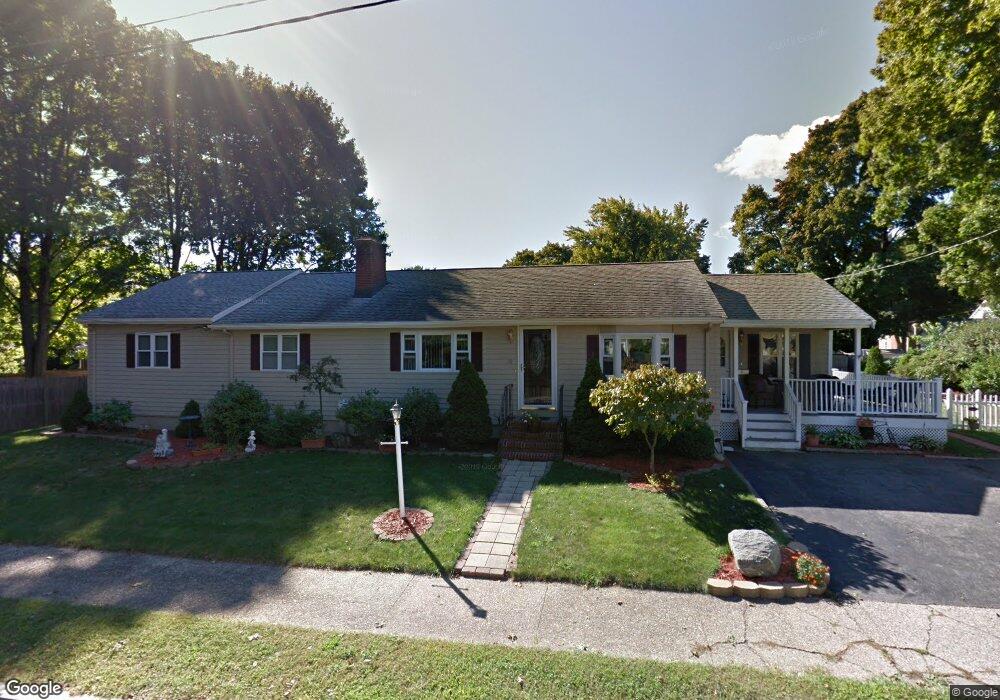
63 Aborn Ave Wakefield, MA 01880
Lakeside NeighborhoodEstimated Value: $819,000 - $901,000
3
Beds
3
Baths
2,676
Sq Ft
$323/Sq Ft
Est. Value
About This Home
This home is located at 63 Aborn Ave, Wakefield, MA 01880 and is currently estimated at $864,849, approximately $323 per square foot. 63 Aborn Ave is a home located in Middlesex County with nearby schools including Wakefield Memorial High School, St Joseph School, and Odyssey Day School.
Ownership History
Date
Name
Owned For
Owner Type
Purchase Details
Closed on
Mar 14, 2003
Sold by
Dellorusso Frank and Dellorusso Rose A
Bought by
Clare Jeffrey M and Clare Nancy M
Current Estimated Value
Home Financials for this Owner
Home Financials are based on the most recent Mortgage that was taken out on this home.
Original Mortgage
$125,000
Outstanding Balance
$53,973
Interest Rate
5.94%
Mortgage Type
Purchase Money Mortgage
Estimated Equity
$810,876
Purchase Details
Closed on
Oct 26, 2001
Sold by
Cardoza Margaret C
Bought by
Dello Russo Frank and Dello Russo Rose A
Purchase Details
Closed on
Mar 31, 1999
Sold by
Motroni Robert H and Motroni Catherine J
Bought by
Cardoza Margaret C
Home Financials for this Owner
Home Financials are based on the most recent Mortgage that was taken out on this home.
Original Mortgage
$188,000
Interest Rate
6.88%
Create a Home Valuation Report for This Property
The Home Valuation Report is an in-depth analysis detailing your home's value as well as a comparison with similar homes in the area
Home Values in the Area
Average Home Value in this Area
Purchase History
| Date | Buyer | Sale Price | Title Company |
|---|---|---|---|
| Clare Jeffrey M | $359,900 | -- | |
| Dello Russo Frank | $359,000 | -- | |
| Cardoza Margaret C | $235,000 | -- |
Source: Public Records
Mortgage History
| Date | Status | Borrower | Loan Amount |
|---|---|---|---|
| Open | Clare Jeffrey M | $125,000 | |
| Previous Owner | Cardoza Margaret C | $188,000 | |
| Previous Owner | Cardoza Margaret C | $188,000 |
Source: Public Records
Tax History
| Year | Tax Paid | Tax Assessment Tax Assessment Total Assessment is a certain percentage of the fair market value that is determined by local assessors to be the total taxable value of land and additions on the property. | Land | Improvement |
|---|---|---|---|---|
| 2025 | $8,326 | $733,600 | $395,100 | $338,500 |
| 2024 | $8,469 | $752,800 | $402,600 | $350,200 |
| 2023 | $8,048 | $686,100 | $366,900 | $319,200 |
| 2022 | $7,479 | $607,100 | $324,600 | $282,500 |
| 2021 | $7,106 | $558,200 | $300,000 | $258,200 |
| 2020 | $6,602 | $517,000 | $277,800 | $239,200 |
| 2019 | $6,365 | $496,100 | $266,600 | $229,500 |
| 2018 | $6,052 | $467,300 | $251,200 | $216,100 |
| 2017 | $5,772 | $443,000 | $238,100 | $204,900 |
| 2016 | $5,517 | $409,000 | $217,900 | $191,100 |
| 2015 | $5,410 | $401,300 | $213,800 | $187,500 |
| 2014 | $4,931 | $385,800 | $205,600 | $180,200 |
Source: Public Records
Map
Nearby Homes
- 57 Wave Ave
- 29 Cordis St
- 16 Beebe Ln
- 67 Woodcrest Dr
- 16 Pleasant St
- 9 2nd St
- 68 Preston St Unit 6D
- 43-45 Crescent St
- 22 Indian Hill Rd
- 10 Wakefield Ave Unit B
- 9 Cyrus St
- 50 Tuttle St Unit 12
- 35 Richardson St Unit 2
- 39 Cedar St
- 1 Traverse St Unit E
- 62 Foundry St Unit 310
- 62 Foundry St Unit 402
- 62 Foundry St Unit 507
- 62 Foundry St Unit 208
- 62 Foundry St Unit 414
Your Personal Tour Guide
Ask me questions while you tour the home.